Year 9 Science Project - Alstonville High School
advertisement
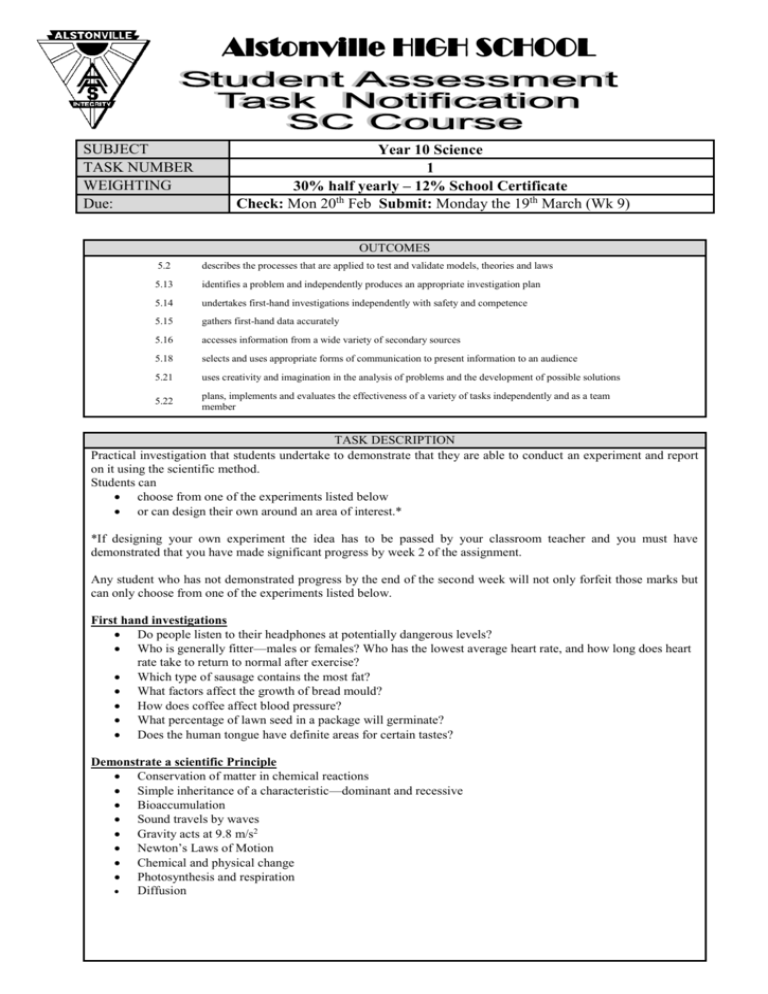
Alstonville HIGH SCHOOL SUBJECT TASK NUMBER WEIGHTING Due: Year 10 Science 1 30% half yearly – 12% School Certificate Check: Mon 20th Feb Submit: Monday the 19th March (Wk 9) OUTCOMES 5.2 describes the processes that are applied to test and validate models, theories and laws 5.13 identifies a problem and independently produces an appropriate investigation plan 5.14 undertakes first-hand investigations independently with safety and competence 5.15 gathers first-hand data accurately 5.16 accesses information from a wide variety of secondary sources 5.18 selects and uses appropriate forms of communication to present information to an audience 5.21 uses creativity and imagination in the analysis of problems and the development of possible solutions 5.22 plans, implements and evaluates the effectiveness of a variety of tasks independently and as a team member TASK DESCRIPTION Practical investigation that students undertake to demonstrate that they are able to conduct an experiment and report on it using the scientific method. Students can choose from one of the experiments listed below or can design their own around an area of interest.* *If designing your own experiment the idea has to be passed by your classroom teacher and you must have demonstrated that you have made significant progress by week 2 of the assignment. Any student who has not demonstrated progress by the end of the second week will not only forfeit those marks but can only choose from one of the experiments listed below. First hand investigations Do people listen to their headphones at potentially dangerous levels? Who is generally fitter—males or females? Who has the lowest average heart rate, and how long does heart rate take to return to normal after exercise? Which type of sausage contains the most fat? What factors affect the growth of bread mould? How does coffee affect blood pressure? What percentage of lawn seed in a package will germinate? Does the human tongue have definite areas for certain tastes? Demonstrate a scientific Principle Conservation of matter in chemical reactions Simple inheritance of a characteristic—dominant and recessive Bioaccumulation Sound travels by waves Gravity acts at 9.8 m/s2 Newton’s Laws of Motion Chemical and physical change Photosynthesis and respiration Diffusion MARKING GUIDELINES/CRITERIA Marks /2 Aim The aim outlines the idea or scientific question you are trying to test. Hypothesis /2 A hypothesis is a prediction or ‘educated guess’ about what you might find in an experiment. A hypothesis is something that can be tested in measurable terms. Variables /3 Identify all the variables that may affect your results. Remember that variables can be classified into three groups: • independent variable—the variable that is changed • dependent variable—the variable that is being measured • controlled variables—the variables that are kept the same throughout the experiment. *If building a model discuss the way you incorporated scale to your design discuss the variables that could be changed in a real world example. Equipment /3 List all the equipment and materials that you need and quantities. Method /7 The method is a step-by-step set of instructions that other scientists at your level of experience could follow to accurately repeat your experiment. When writing the instructions, include the following information: • the one variable that you are going to change • how you are going to change it and by how much • how you are going to control all the other variables • diagrams, drawings or photographs • how you are going to measure the changes • how you are going to record the changes, such as in a results table. Your experimental method should be replicated a number of times so that a more accurate conclusion can be drawn. Progress check - Students have demonstrated the ability to research and plan an experimental investigation Results /5 /5 Results can be of two types: • Results or data that are numerical are called quantitative as they usually measure amounts or quantities. • If you are using your senses to observe, you are making observations. Qualitative observations are written down as a description or recorded as a picture or diagram. You should also record any other things you notice, particularly any problems you had with your investigation. If appropriate, include a photographic essay of your project steps or results. These will assist in your final analysis. You could keep a detailed process diary of observations, data, and results while completing your experiment. Discussion /8 In the discussion you should analyse and evaluate your results in detail: • Analyse and present your data or observations in different ways to show any patterns or trends. This is where a graph may be useful. Line graphs should be used when both the independent and dependent variables are numerical. • Explain any trends or patterns in your observations, data and results. • Explain why the results occurred and what they demonstrated. • Evaluate the success of your investigation. • Outline any errors that may have affected your results. Errors are unavoidable, but mistakes are because of clumsiness. Report your errors, not your mistakes. Describe any difficulties or problems you had in doing the investigation. • Explain how your experiment could be improved to gain better or more dependable results. Conclusion /3 A conclusion is simply a summary of the results of your experiment. A good conclusion will: • answer your aim • identify whether your experiment proved or disproved your hypothesis. Use any trends you saw in the results as proof. • identify any changes that you would make if you had to repeat this investigation. Resource list /4 This is sometimes called a bibliography and is a list of all the resources and references you used. You may also wish to make any acknowledgements here ( people who have helped you out). Literacy – Clarity of writing – should be easy to read, grammar and spelling should have been checked (get someone to proof read or use the checks on the computer). Use of the correct scientific terms. Presentation- Clearly set out using the headings in the above marking criteria. Diagrams, graphs and charts clearly labelled. Layout is easy to follow and understand. Total /5 /3 /50

