Additional file 4: Table S3. - Molecular Neurodegeneration
advertisement
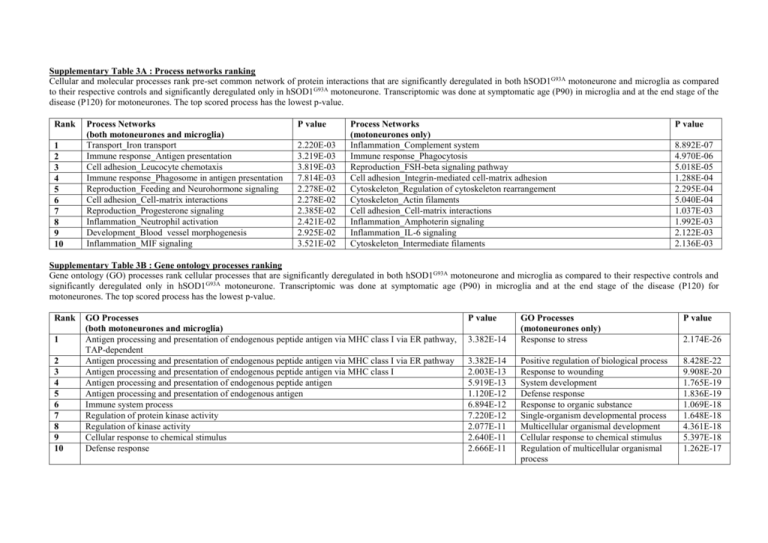
Supplementary Table 3A : Process networks ranking Cellular and molecular processes rank pre-set common network of protein interactions that are significantly deregulated in both hSOD1G93A motoneurone and microglia as compared to their respective controls and significantly deregulated only in hSOD1G93A motoneurone. Transcriptomic was done at symptomatic age (P90) in microglia and at the end stage of the disease (P120) for motoneurones. The top scored process has the lowest p-value. Rank 1 2 3 4 5 6 7 8 9 10 Process Networks (both motoneurones and microglia) Transport_Iron transport Immune response_Antigen presentation Cell adhesion_Leucocyte chemotaxis Immune response_Phagosome in antigen presentation Reproduction_Feeding and Neurohormone signaling Cell adhesion_Cell-matrix interactions Reproduction_Progesterone signaling Inflammation_Neutrophil activation Development_Blood vessel morphogenesis Inflammation_MIF signaling P value 2.220E-03 3.219E-03 3.819E-03 7.814E-03 2.278E-02 2.278E-02 2.385E-02 2.421E-02 2.925E-02 3.521E-02 Process Networks (motoneurones only) Inflammation_Complement system Immune response_Phagocytosis Reproduction_FSH-beta signaling pathway Cell adhesion_Integrin-mediated cell-matrix adhesion Cytoskeleton_Regulation of cytoskeleton rearrangement Cytoskeleton_Actin filaments Cell adhesion_Cell-matrix interactions Inflammation_Amphoterin signaling Inflammation_IL-6 signaling Cytoskeleton_Intermediate filaments P value 8.892E-07 4.970E-06 5.018E-05 1.288E-04 2.295E-04 5.040E-04 1.037E-03 1.992E-03 2.122E-03 2.136E-03 Supplementary Table 3B : Gene ontology processes ranking Gene ontology (GO) processes rank cellular processes that are significantly deregulated in both hSOD1G93A motoneurone and microglia as compared to their respective controls and significantly deregulated only in hSOD1G93A motoneurone. Transcriptomic was done at symptomatic age (P90) in microglia and at the end stage of the disease (P120) for motoneurones. The top scored process has the lowest p-value. Rank 1 2 3 4 5 6 7 8 9 10 GO Processes (both motoneurones and microglia) Antigen processing and presentation of endogenous peptide antigen via MHC class I via ER pathway, TAP-dependent Antigen processing and presentation of endogenous peptide antigen via MHC class I via ER pathway Antigen processing and presentation of endogenous peptide antigen via MHC class I Antigen processing and presentation of endogenous peptide antigen Antigen processing and presentation of endogenous antigen Immune system process Regulation of protein kinase activity Regulation of kinase activity Cellular response to chemical stimulus Defense response P value 3.382E-14 3.382E-14 2.003E-13 5.919E-13 1.120E-12 6.894E-12 7.220E-12 2.077E-11 2.640E-11 2.666E-11 GO Processes (motoneurones only) Response to stress P value Positive regulation of biological process Response to wounding System development Defense response Response to organic substance Single-organism developmental process Multicellular organismal development Cellular response to chemical stimulus Regulation of multicellular organismal process 8.428E-22 9.908E-20 1.765E-19 1.836E-19 1.069E-18 1.648E-18 4.361E-18 5.397E-18 1.262E-17 2.174E-26 Supplementary Table 3C : Pathway maps ranking Canonical pathway maps rank signaling and metabolic maps that are significantly in both hSOD1G93A motoneurone and microglia as compared to their respective controls and significantly deregulated only in hSOD1G93A motoneurone. Transcriptomic was done at symptomatic age (P90) in microglia and at the end stage of the disease (P120) for motoneurones. The top scored process has the lowest p-value. Rank Pathway Maps (both motoneurones and microglia) P value Pathway Maps (motoneurones only) P value 1 2 3 Heme metabolism Schema: Initiation of T cell recruitment in allergic contact dermatitis Role of ZNF202 in regulation of expression of genes involved in atherosclerosis DNA damage_ATM / ATR regulation of G2 / M checkpoint DNA damage_Brca1 as a transcription regulator DNA damage_ATM/ATR regulation of G1/S checkpoint p53 signaling in Prostate Cancer Immune response_Role of integrins in NK cells cytotoxicity Transcription_P53 signaling pathway Development_Role of Activin A in cell differentiation and proliferation 2.368E-04 1.252E-03 1.710E-03 Immune response_Classical complement pathway Immune response_Lectin induced complement pathway Cell cycle_Regulation of G1/S transition (part 1) 6.852E-10 6.123E-09 3.565E-05 2.622E-03 3.484E-03 3.958E-03 4.205E-03 5.549E-03 5.838E-03 6.134E-03 Immune response_Alternative complement pathway Cytoskeleton remodeling_Cytoskeleton remodeling Cytoskeleton remodeling_Neurofilaments Transcription_Transcription regulation of aminoacid metabolism Cytoskeleton remodeling_TGF, WNT and cytoskeletal remodeling Development_Transcription regulation of granulocyte development IL-6 signaling in multiple myeloma 4.156E-05 5.013E-05 5.024E-05 5.024E-05 9.731E-05 1.732E-04 1.944E-04 4 5 6 7 8 9 10
