ece31426-sup-0002
advertisement
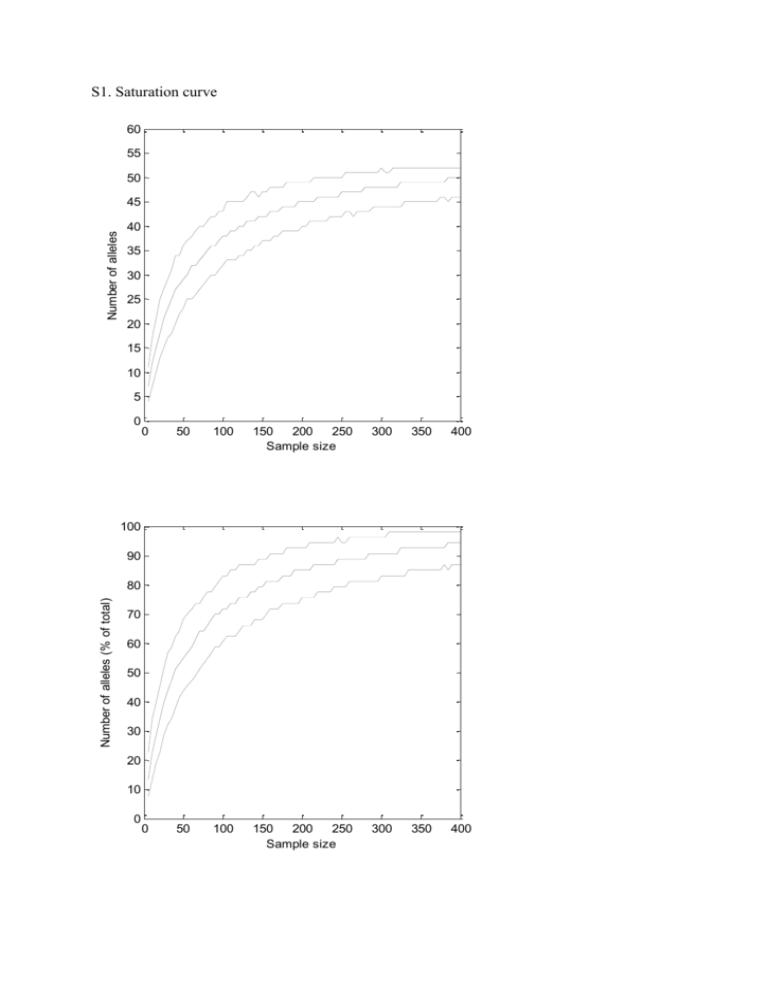
S1. Saturation curve 60 55 50 Number of alleles 45 40 35 30 25 20 15 10 5 0 0 50 100 150 200 250 Sample size 300 350 400 0 50 100 150 200 250 Sample size 300 350 400 100 90 Number of alleles (% of total) 80 70 60 50 40 30 20 10 0 Data S2. Test of the bias involved in calculating FST. We calculated the minimum and maximum number of possible loci for each individual based on the individual allele numbers found. The maximum number of loci in an individual was calculated as being equivalent to the number of different alleles found assuming that each allele is in the homozygous state. Likewise the minimum number of alleles was calculated assuming that all alleles are in the heterozygous state. Thus, if we found e.g. five alleles in an individual this could reflect either a maximum of five homozygous loci or a minimum of three loci (two heterozygous and one homozygous locus). Thus, in the “maximum number of loci” assumption we calculated allele frequencies with a maximum of ten alleles although we in reality only counted five alleles assuming that ten alleles are present in the individual due to the homozygous state of five loci present. Accordingly allele frequencies under the “minimum number of loci” assumption were calculated. Using both assumptions, we randomly drew the number of alleles from the range of possible alleles as described above and calculated allele frequencies and pairwise FST-values. This was repeated 10 000 times to get 95 % intervals. The open circles are the observed FST-values, the black circles are the simulated FST-values and the dotted lines the 95 % interval. The open squares represent the upper 97.5 % level based on sampling only. In short, the larger FST-values are overestimated, while the smaller ones underestimated, but the magnitude of the bias is much lower than the uncertainty due to finite sample sizes. 0.6 0.5 0.4 0.3 FST 0.2 0.10 0.05 0.00 1977 1980 1983 1986 1989 1992 1995 1998 2001 2004 2007 2010 Year
