Colligative Properties
advertisement
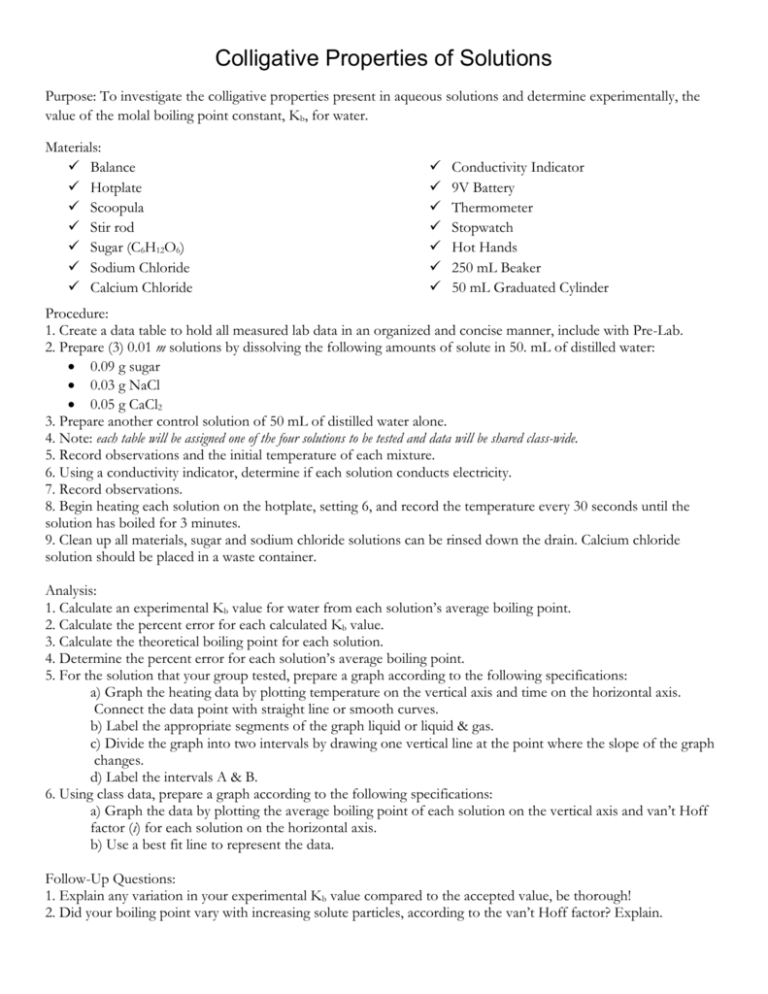
Colligative Properties of Solutions Purpose: To investigate the colligative properties present in aqueous solutions and determine experimentally, the value of the molal boiling point constant, Kb, for water. Materials: Balance Hotplate Scoopula Stir rod Sugar (C6H12O6) Sodium Chloride Calcium Chloride Conductivity Indicator 9V Battery Thermometer Stopwatch Hot Hands 250 mL Beaker 50 mL Graduated Cylinder Procedure: 1. Create a data table to hold all measured lab data in an organized and concise manner, include with Pre-Lab. 2. Prepare (3) 0.01 m solutions by dissolving the following amounts of solute in 50. mL of distilled water: 0.09 g sugar 0.03 g NaCl 0.05 g CaCl2 3. Prepare another control solution of 50 mL of distilled water alone. 4. Note: each table will be assigned one of the four solutions to be tested and data will be shared class-wide. 5. Record observations and the initial temperature of each mixture. 6. Using a conductivity indicator, determine if each solution conducts electricity. 7. Record observations. 8. Begin heating each solution on the hotplate, setting 6, and record the temperature every 30 seconds until the solution has boiled for 3 minutes. 9. Clean up all materials, sugar and sodium chloride solutions can be rinsed down the drain. Calcium chloride solution should be placed in a waste container. Analysis: 1. Calculate an experimental Kb value for water from each solution’s average boiling point. 2. Calculate the percent error for each calculated Kb value. 3. Calculate the theoretical boiling point for each solution. 4. Determine the percent error for each solution’s average boiling point. 5. For the solution that your group tested, prepare a graph according to the following specifications: a) Graph the heating data by plotting temperature on the vertical axis and time on the horizontal axis. Connect the data point with straight line or smooth curves. b) Label the appropriate segments of the graph liquid or liquid & gas. c) Divide the graph into two intervals by drawing one vertical line at the point where the slope of the graph changes. d) Label the intervals A & B. 6. Using class data, prepare a graph according to the following specifications: a) Graph the data by plotting the average boiling point of each solution on the vertical axis and van’t Hoff factor (i) for each solution on the horizontal axis. b) Use a best fit line to represent the data. Follow-Up Questions: 1. Explain any variation in your experimental Kb value compared to the accepted value, be thorough! 2. Did your boiling point vary with increasing solute particles, according to the van’t Hoff factor? Explain.

