nph12190-sup-0001-FigureS1-S6
advertisement
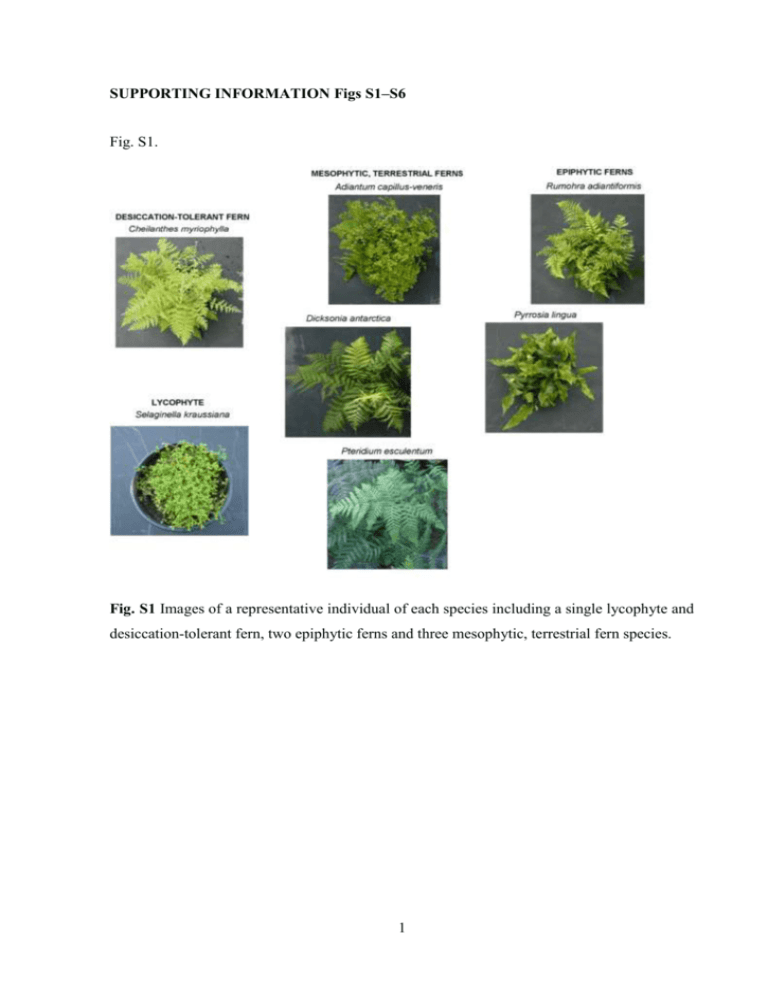
SUPPORTING INFORMATION Figs S1–S6 Fig. S1. Fig. S1 Images of a representative individual of each species including a single lycophyte and desiccation-tolerant fern, two epiphytic ferns and three mesophytic, terrestrial fern species. 1 Fig. S2. Fig. S2 Pressure–volume relationships for three mesophytic terrestrial fern species (a-c), a lycophyte (d), two epiphytic fern species (e and f), a desiccation-tolerant fern (g) and an angiosperm (f) with vertical lines representing turgor loss point (data points represent the combined data from 5 leaves). 2 Fig. S3. Fig. S3 Stomatal conductivity of leaves rehydrated overnight from known droughted leaf water potentials, in three mesophytic terrestrial ferns (a–c), a lycophyte (d), two epiphytic ferns (e and f) and a desiccation-tolerant fern (g). Dashed red vertical lines represent the leaf water potential at which assimilation rate does not recover (A0) (absent from the desiccationtolerant fern Cheilanthes myriophylla). 3 Fig. S4. Fig. S4 The relationship between foliar ABA level (µg g-1 dry weight) and stomatal conductance before stomatal closure in three mesophytic terrestrial fern species (a–c) and a lycophyte (d), two epiphytic fern species (e and f) and a desiccation-tolerant fern species (g) when droughted (white circles) and recovered (black squares). 4 Fig. S5. Fig. S5 The relationship between foliar ABA level (µg g-1 dry weight) and leaf water potential (-MPa), pooled from three individuals of three mesophytic terrestrial fern species (a–c) and a lycophyte (d), two epiphytic fern species (e and f) and a desiccation-tolerant fern species (g) when droughted by withholding water (open circles). Solid vertical lines represent Ψl when stomata closed (see Fig. 1) and dashed red vertical lines represent Ψl at which assimilation rate did not recover in rehydrated leaves (A0). Square symbols each represent measurements made on individuals that were rehydrated. 5 Fig. S6. Fig. S6 The responses of stomatal conductance (mol m-2 s-1) in three leaves to step-wise transitions in vapour pressure deficit (kPa) in six fern species (a–f) and a lycophyte (g). 6

