Lab 1: Scientific Method and Measurements Materials Needed
advertisement

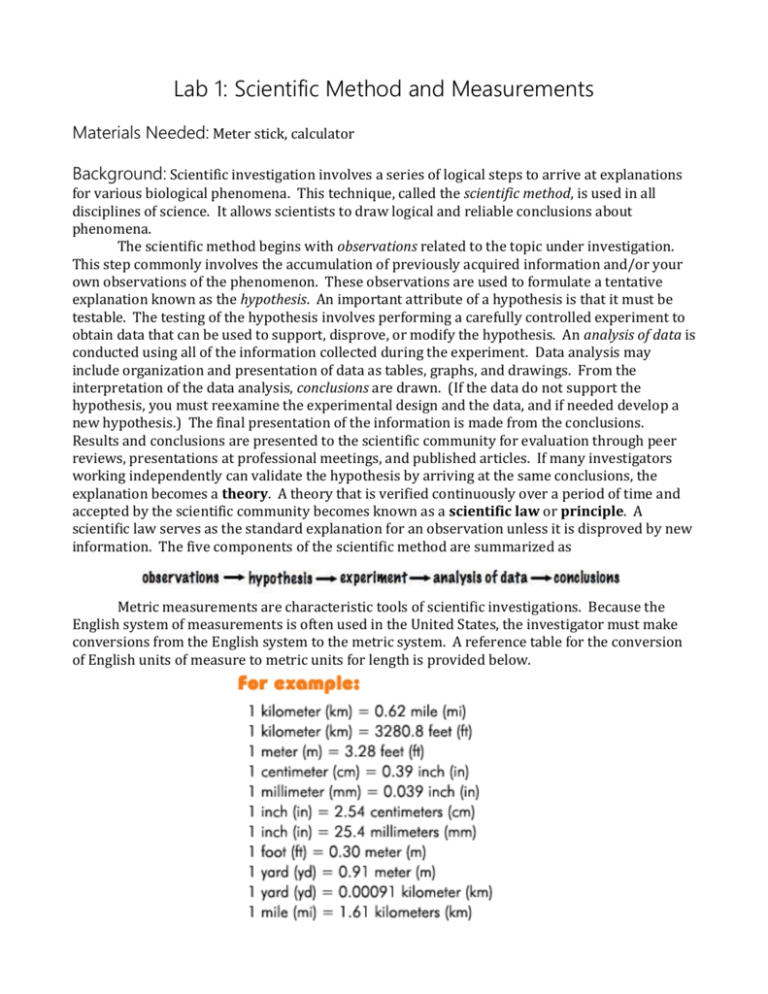
Lab 1: Scientific Method and Measurements Materials Needed: Meter stick, calculator Background: Scientific investigation involves a series of logical steps to arrive at explanations for various biological phenomena. This technique, called the scientific method, is used in all disciplines of science. It allows scientists to draw logical and reliable conclusions about phenomena. The scientific method begins with observations related to the topic under investigation. This step commonly involves the accumulation of previously acquired information and/or your own observations of the phenomenon. These observations are used to formulate a tentative explanation known as the hypothesis. An important attribute of a hypothesis is that it must be testable. The testing of the hypothesis involves performing a carefully controlled experiment to obtain data that can be used to support, disprove, or modify the hypothesis. An analysis of data is conducted using all of the information collected during the experiment. Data analysis may include organization and presentation of data as tables, graphs, and drawings. From the interpretation of the data analysis, conclusions are drawn. (If the data do not support the hypothesis, you must reexamine the experimental design and the data, and if needed develop a new hypothesis.) The final presentation of the information is made from the conclusions. Results and conclusions are presented to the scientific community for evaluation through peer reviews, presentations at professional meetings, and published articles. If many investigators working independently can validate the hypothesis by arriving at the same conclusions, the explanation becomes a theory. A theory that is verified continuously over a period of time and accepted by the scientific community becomes known as a scientific law or principle. A scientific law serves as the standard explanation for an observation unless it is disproved by new information. The five components of the scientific method are summarized as Metric measurements are characteristic tools of scientific investigations. Because the English system of measurements is often used in the United States, the investigator must make conversions from the English system to the metric system. A reference table for the conversion of English units of measure to metric units for length is provided below. Procedure A – Using the Steps of the Scientific Method 1. Many people have observed a correlation between the length of the upper and lower limbs and the height of an individual. For example, a person who has long upper limbs (the arm, forearm, and hand combined) tends to be tall. Make some visual observations of other people in your class to observe a possible correlation. 2. From such observations, the following hypothesis is formulated: The length of a person’s upper limb is equal to 0.4 (40%) of the height of the person. Test this hypothesis by performing the following experiment. 3. In this experiment use a meter stick to measure an upper limb length of ten subjects. For each measurement, place the meter stick in the axilla (armpit) and record the length in centimeters to the end of the longest finger. Obtain the height of each person in centimeters by measuring him or her without shoes against a wall. The height of each person can be calculated by multiplying each individual’s height in inches by 2.54 to obtain his/her height in centimeters. Record all your measurements in Part A in a table. 4. The data collected from all of the measurements can now be analyzed. The expected predicted) correlation between upper limb length and height is determined using the following equation. Height x 0.4 = expected upper limb length The observed (actual) correlation to be used to test the hypothesis is determined by Length of upper limb/height = actual % of height 5. A graph is an excellent way to display a visual representation of the data. Plot the upper limb length of each subject on the x-axis and height of each person on the y-axis. A line is already located on the graph that represents a hypothetical relationship of 0.4 (40%) upper limb length compared to height. This is a graphic representation of the original hypothesis. 6. Compare the distribution of all of the points that you placed on the graph with the distribution of the expected correlation represented by the hypothesis. 7. Complete the lab report. Procedure B – Design an Experiment You have probably concluded that there is some correlation of the length of body parts to height. Often when a skeleton is found, it is not complete, especially when paleontologists discover a skeleton. It is occasionally feasible to use the length of a single bone to estimate the height of an individual. Observe a human skeleton and locate the radius bone in the forearm. Use your observations to identify a mathematical relationship between the length of the radius and height. Formulate a hypothesis that can be tested. Make measurements, analyze data, and develop a conclusion from your experiment. Names: __________________________________________________________________________________ Period: __________ Lab 1: Scientific Method and Measurements Background 1. Define (in your own words) the following terms. a. observations b. hypothesis c. experiment d. analysis of data e. conclusions f. theory g. scientific law/principle 2. How many centimeters are in an inch? 3. How many centimeters are in 6 feet? Show your work. 4. If a person is 167 centimeters tall, how tall are they in feet and inches? Show your work. Procedure A – Using the Steps of the Scientific Method 1. Record your measurements for height and upper limb length in the table below. Subject Height (cm) Measured Upper Height x 0.4 = Actual % of height = Upper Limb Length (cm) Expected Upper Limb Length (cm)/Height Limb Length (cm) (cm) 2. Plot the distribution of data (upper limb length and height) collected for the ten subjects on the following graph. The line located on the graph represents the expected 0.4 (40%) ration of upper limb length to measured height (the original hypothesis). (Note that the x-axis represents upper limb length and the y-axis represents height.) Draw a line of best fit through the distribution of points of the plotted data of the ten subjects. Upper Limb Length (cm) vs. Height (cm) 210 200 Height (cm) 190 180 170 160 150 140 56 60 64 68 72 Upper Limb Length (cm) 76 80 84 3. Does the distribution of the ten subjects’ measured upper limb lengths support or disprove the original hypothesis. Explain your answer. If your measurements disprove the original hypothesis, suggest reasons why this might be so. Procedure B – Design an Experiment NEATLY complete ON A SEPARATE SHEET OF PAPER. Messy/sloppy/unprofessional work will result in a loss of points. 1. Describe your observations of a possible correlation between the radius length and height. 2. Write a hypothesis based on your observations. 3. Describe the design of the experiment that you devised to test your hypothesis. 4. Create a data table. 5. Analyze your data by graphing your EXPECTED and ACTUAL results. (Note: Make sure to title your graph, label your axes, and differentiate your two lines.) 6. Does the distribution of your data support or disprove your hypothesis. Explain your answer. If your data disproves your hypothesis, suggest reasons why this might be so.


