REVISION ADDRESSING COMMENT REVIEWER Lines 13
advertisement
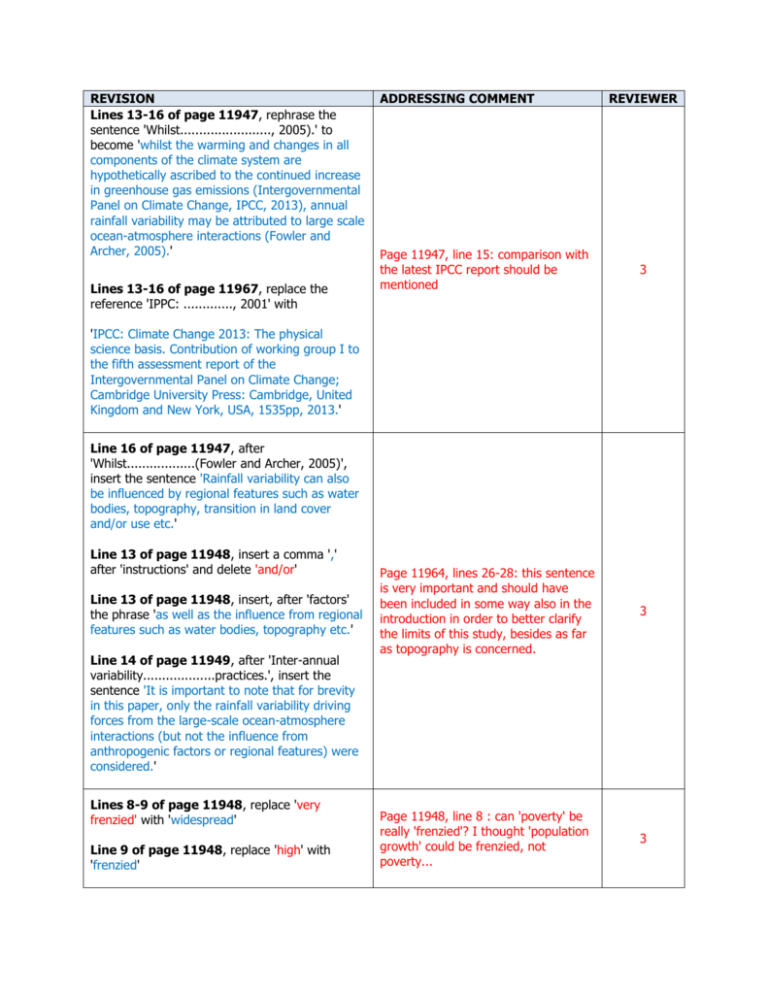
REVISION
Lines 13-16 of page 11947, rephrase the
sentence 'Whilst........................, 2005).' to
become 'whilst the warming and changes in all
components of the climate system are
hypothetically ascribed to the continued increase
in greenhouse gas emissions (Intergovernmental
Panel on Climate Change, IPCC, 2013), annual
rainfall variability may be attributed to large scale
ocean-atmosphere interactions (Fowler and
Archer, 2005).'
Lines 13-16 of page 11967, replace the
reference 'IPPC: ............., 2001' with
ADDRESSING COMMENT
REVIEWER
Page 11947, line 15: comparison with
the latest IPCC report should be
mentioned
3
Page 11964, lines 26-28: this sentence
is very important and should have
been included in some way also in the
introduction in order to better clarify
the limits of this study, besides as far
as topography is concerned.
3
Page 11948, line 8 : can 'poverty' be
really 'frenzied'? I thought 'population
growth' could be frenzied, not
poverty...
3
'IPCC: Climate Change 2013: The physical
science basis. Contribution of working group I to
the fifth assessment report of the
Intergovernmental Panel on Climate Change;
Cambridge University Press: Cambridge, United
Kingdom and New York, USA, 1535pp, 2013.'
Line 16 of page 11947, after
'Whilst..................(Fowler and Archer, 2005)',
insert the sentence 'Rainfall variability can also
be influenced by regional features such as water
bodies, topography, transition in land cover
and/or use etc.'
Line 13 of page 11948, insert a comma ','
after 'instructions' and delete 'and/or'
Line 13 of page 11948, insert, after 'factors'
the phrase 'as well as the influence from regional
features such as water bodies, topography etc.'
Line 14 of page 11949, after 'Inter-annual
variability...................practices.', insert the
sentence 'It is important to note that for brevity
in this paper, only the rainfall variability driving
forces from the large-scale ocean-atmosphere
interactions (but not the influence from
anthropogenic factors or regional features) were
considered.'
Lines 8-9 of page 11948, replace 'very
frenzied' with 'widespread'
Line 9 of page 11948, replace 'high' with
'frenzied'
REVISION
ADDRESSING COMMENT
REVIEWER
Line 9 of page 11949, after 'Outside the study
area.............the Andes region of Ecuador.' insert
a new paragraph with the below text.
The shortcomings of the above recent studies
that applied the QPM on the rainfall variability of
the Nile Basin as addressed in this study include:
1) lack of attempts to investigate any possible
linkages of the rainfall variability to oceanatmosphere interactions by Mbungu et al. (2012),
and Onyutha and Willems (2014a, b), (2) the
use of few climate indices or series to explain
rainfall variability by Moges et al. (2014), NyekoOgiramoi et al. (2013), and Taye and Willems
(2012), and (3) the limitation of the variability
study to sub catchments of the Nile Basin. In line
with shortcoming (3), considering the entire River
Nile Basin would be helpful in understanding the
regional differences in the rainfall statistics. This
is vital in regional planning for the management
of agricultural practices given that subsistence
and rain-fed agriculture, together with high
rainfall variability is one of the main causes of
food insecurity and the most daunting challenge
the entire Nile Basin faces (Melesse et al. (2011).
The authors should explain in details
the innovating aspects of this study
compared to previous publications.
2
Page 11968, Between 'McHugh............' and
'Moges...........' insert the new reference '
Melesse, A. M., Bekele, S., and McCornick, P.:
Introduction: hydrology of the Nile in the face of
climate and land-use dynamics. In: Nile River
basin: hydrology, climate and water use, edited
by: Melesse, A.M., Dordecht, The Netherlands:
Springer, vii–xvii, 2011.'
Line 22 of page 11949 after ‘…………data
points not more than 10% were used’, insert new
sentences 'However, to check on the spatial
coherence of the variability results across the
study area, the period of not less than 35 years
over which each station had rainfall data was
considered. This was done because of the spatial
coherence of the temporal variability results that
could be obtained on a regional basis when data
from the different meteorological stations are of
the same length and picked over the same time
period for analysis.'
Line 3 of page 11951, insert 'stronger' in
between 'its' and 'variability'
Lines 7-8 p. 11959: “Correlations for
groups A to C are obtained over the
periods in which each station had data
records i.e. 1935–1970 (36 years?),
1954–1992 (39 years?) and 1945–
1985 respectively.” This is apparently
in contrast with lines 20-22 at p.
11949: “To enhance the acceptability
of the research findings, long-term
rainfall series of length not less than
40years and missing data points not
more than 10% were used.” and
Table 1. Please check.
Page 11951, line 3: 'runoff values and
its variability' should rather be 'runoff
values and its stronger
variability'
2
3
REVISION
Line 12 of page 11954, after the sentence
'.........entire time series.', insert a new paragraph
with the text below:
It is well-known that the estimation of Ts from
small sample series can be characterized by bias.
This bias becomes large when the T being
estimated (by extrapolation after fitting
theoretical distribution in the frequency analysis)
is far higher than the data record length. To
ensure that the bias in the anomalies computed
over each time slice does not significantly affect
the QPM variability results, extrapolations are
avoided. This is done by considering only the
empirical Ts i.e. Ts not greater than D (for each
time slice) or n (for the full series).
ADDRESSING COMMENT
With reference to the methodology,
the QPM is based on a comparison
between quantiles with similar return
periods derived from the complete
time series of length n and subseries
of fixed length D. Return periods are
computed as n/j or D/j, with j the rank
of each value of the series sorted in
descending order. For small sample
series (i.e. n<100) the latter
represents a biased estimator of
return periods for all distributions,
thus in principle it would not be
recommended. The authors should
demonstrate that the use of an
unbiased estimator does not change
the results significantly.
REVIEWER
2
Line 15 of page 11954, insert '(Figure 2a)'
after '15 years'.
Line 16 of page 11954, insert these two
sentences in between "....the study." and "A
block length........" 'It can be noted from Fig. 2a
that the computed anomalies are
over/underestimated for lower than higher time
slice. Furthermore, as the block length increases,
the pattern of persistence in the rainfall quantiles
becomes smoother or clearer.'
Replace the old Figure 2 on page 11978
with the new one attached (also shown at
the end of this table).
Page 11978, change the caption of Figure 2 to
'QPM results at station 7 for the period 1935–
1970 using time slice(s) a) considered in
sensitivity analysis (5, 10 and 15 years), and b)
selected for the study (15 years).'
Line 11 of page 11958, replace 'Kiiza' by
'Kizza'
Line 15 of page 11958, change '1930s' to
'1920s'
Line 17-18 of page 11958, delete the
sentence 'Another period of OH was in the early
1920s to mid 1930s. This OH was significant at
stations 18, 21–23, and 27.'
Lines 1, 8 and 17 of pages 11959, 11963,
and 11963 respectively, insert 'rainfall'
between 'MAM' and 'of'
Page 11954, line 16-18: evidence to
this finding should be included or the
finding itself should be
better explained: in what sense the
given oscillation pattern was given
clearer?
Page 11956, line 3: the up and down
arrows are missing in figure 2
Page 12-Line 3. It is
written in the text “The up and down
arrows: : :.”. However, there are no
arrows in figure.
3
3
1
2) Figure 2. The name of the station
(i.e. station 7) should be mentioned in
the caption of the figure.
1
Page 11958, line 11: is it Kiiza or Kizza
(as listed in the reference list)?
3
Page 11958, lines 15-18: a whole OH
is actually split in two separate OH for
the analysis, this
should be explained and motivated.
3
Page 11963, line 17: 'MAM of group A'
should rather be 'MAM rainfall of
group A'
3
REVISION
Line 1 of page 11959, insert 'rainfall' between
'JJAS' and 'of'
Line 21-23 of page 11960, rephrase this
sentence to become: 'The spatial maps for
correlations between HadSLP2 or HadSST2 and
annual rainfall are presented in Figs. 5 and 6. For
the correlations between HadSLP2 or HadSST2
and the rainfall in the main wet seasons of the
different groups, the spatial maps are shown in
Figs. A1 and B1.'
ADDRESSING COMMENT
Lines 21-23 p. 11960. “Although for
brevity, spatial maps for correlations
between HadSLP2 or HadSST2 and
annual rainfall are presented Figs. 5
and 6, for those with the rainfall in the
main wet seasons of the different
groups, see Figs. A1 and B1.” Please
rephrase.
REVIEWER
2
Grist, J. P. .........(in lines 20-21 of 11966),
Goovaerts, P. .........(in lines 23-23 of 11966),
and Gleick, P. H. .....(in lines 24-27 of 11966),
should be rearranged alphabetically in the order:
Gleick, P. H. ..........
Goovaerts, P. .........
Grist, J. P. ............
The reference Kundzewicz.....(in lines 30-31 of
page 11967) and Kummu......(in lines 1-3 of
page 11968) should be arranged alphabetically
in the order:
Pages 11966-11967: in these two
pages the references are not always
listed in alphabetical order
(Grist, Goovaerts, Gleick, … and then
Kundzewicz, Kummu)
3
Kummu..................
Kundzewicz....................
Line 15 of page 11969, change 'GaddiNgirare, K.' to 'Ngirane-Katashaya, G.'
Page 11975, change the caption of Table 4 to
'Correlation between QPM results for annual
rainfall and climate indices over the periods1935–
1970 (for group A), 1954–1992 (for group B) and
1945–1985 (for group C).'
Page 11976, change the caption of Table 5 to
'Correlation between QPM results for annual
rainfall and climate indices considering full series
with lengths of data records shown in Table 1.'
Page 11981, change the caption of Figure 5 to
'Correlation between anomaly in annual Sea Level
Pressure (SLP) and that in region-wide annual
rainfall for group (a) A, (b) B, (c) C. In the
legend, Gp denotes group.'
Page 11982, change the caption of Figure 6 to
'Correlation between annual Sea Surface
Temperature (SST) and that in region-wide
annual rainfall for group (a) A, (b) B, (c) C. In
the legend, Gp denotes group.'
Replace the old Figure 1 on page 11977
Correction based on observation from the authors
I suggest to homogenize captions of
Tables 4 and 5, as well as captions of
Figures 5 and 6.
Figure 1: I would use different
2
3
REVISION
with the new one attached (also shown at
the end of this table).
Replace the old Figure 7 on page 11983
with the new one attached (also shown at
the end of this table).
Second line of the Figure 7 caption on page
11983, Change ‘( )’ to ‘[ ].
Page 11986, in the caption of Figure B1,
change 'SLP' to 'SST'
ADDRESSING COMMENT
symbols for the three different station
groups and I would add country
boundaries. LTM is not obvious, Long
Term Mean should be written in the
caption.
Figure 1. The groups of rainfall
stations (i.e. A, B, C) should be shown
in Figure 1.
REVIEWER
1
Figure 7: In the caption only charts ac and d-f are explained, what are gh??
3
Figure B1: in the caption SLP should
be substituted by SST.
3
Figure 1. Locations of the selected meteorological stations (see Table 1 for details) in the Nile
Basin; the background is based on the Long Term Mean (LTM) of annual rainfall.
Figure 2. QPM results at station 7 for the period 1935–1970 using time slice(s) a) considered in
sensitivity analysis (5, 10 and 15 years), and b) selected for the study (15 years).
Figure 7. Annual SLP differences and rainfall at selected stations of the different groups A–
C for a time slice of 5 years; the group labels are in [ ]. The label of a legend indicates the
coordinates (degree longitude and latitude) from where the SLP differences were taken. The
label in { } show the locations where the coordinates are found. Annual and seasonal time
scales are shown in charts (a)–(c) and (d)–(f) respectively.


