BIOL/PBIO 3333 Genetics 3/29/13 For answers to the quiz, click here
advertisement
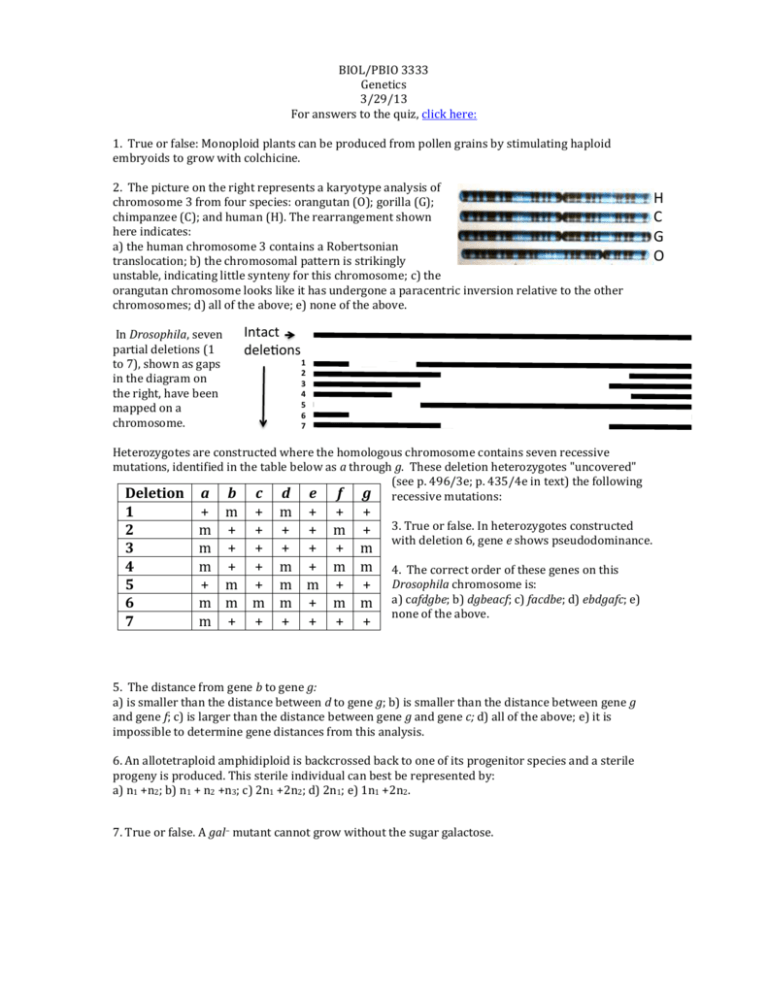
BIOL/PBIO 3333 Genetics 3/29/13 For answers to the quiz, click here: 1. True or false: Monoploid plants can be produced from pollen grains by stimulating haploid embryoids to grow with colchicine. 2. The picture on the right represents a karyotype analysis of chromosome 3 from four species: orangutan (O); gorilla (G); chimpanzee (C); and human (H). The rearrangement shown here indicates: a) the human chromosome 3 contains a Robertsonian translocation; b) the chromosomal pattern is strikingly unstable, indicating little synteny for this chromosome; c) the orangutan chromosome looks like it has undergone a paracentric inversion relative to the other chromosomes; d) all of the above; e) none of the above. In Drosophila, seven partial deletions (1 to 7), shown as gaps in the diagram on the right, have been mapped on a chromosome. Intact dele ons 1 2 3 4 5 6 7 Heterozygotes are constructed where the homologous chromosome contains seven recessive mutations, identified in the table below as a through g. These deletion heterozygotes "uncovered" (see p. 496/3e; p. 435/4e in text) the following Deletion a b c d e f g recessive mutations: 1 2 3 4 5 6 7 + m + m + + m + + m + + + m + m m m m + + m + + + + + m + + + + m m + m m m m + + m + m m + + + + 3. True or false. In heterozygotes constructed with deletion 6, gene e shows pseudodominance. 4. The correct order of these genes on this Drosophila chromosome is: a) cafdgbe; b) dgbeacf; c) facdbe; d) ebdgafc; e) none of the above. 5. The distance from gene b to gene g: a) is smaller than the distance between d to gene g; b) is smaller than the distance between gene g and gene f; c) is larger than the distance between gene g and gene c; d) all of the above; e) it is impossible to determine gene distances from this analysis. 6. An allotetraploid amphidiploid is backcrossed back to one of its progenitor species and a sterile progeny is produced. This sterile individual can best be represented by: a) n1 +n2; b) n1 + n2 +n3; c) 2n1 +2n2; d) 2n1; e) 1n1 +2n2. 7. True or false. A gal− mutant cannot grow without the sugar galactose. H C G O a+b− Four E. coli strains of genotype are labeled 1, 2, 3, 4. Four strains of genotype a−b+ are labeled 5, 6, 7 and 8. The two genotypes are mixed in all possible combinations and (after incubation) are plated to determine the frequency of a+b+ recombinants. The results indicated in the table are obtained, where M = many recombinants, L = low numbers of recombinants, and 0 = no recombinants. The strains can be classified as 3 sex types: either F−, F+ or Hfr with regard to a and b gene transfer. strains 1 2 3 4 5 L L 0 M 6 0 0 M 0 7 L L 0 M 8 L L 0 M 8. The Hfr strains present in this data set are represented by: a) strain 3 only; b) strain 4 only; c) strains 3 and 4; d) strains 5, 6, 7, 8; e) none of the above. Questions 9-10 pertain to the following. An Hfr strain of the genotype a+b+c+d+strs is mated with a female strain of the genotype a−b−c−d−strr. At various times the culture is disrupted in a blender to separate the mating pairs. The cells are then plated on agar of the following four agar types (see table below, right), where nutrient A allows the growth of a− auxotrophs, nutrient B allows for the growth of b− autxotrophs, etc. As indicated, all types contain streptomycin (Str). A (+) indicates the presence of the nutrient or drug, a (-) indicates its absence. agar entry time 0 2.5 5 7.5 10 12.5 15 17.5 20 25 30 35 1 2 3 4 0 0 0 443 725 954 1166 1323 1400 1437 1450 1462 0 0 0 0 0 0 0 0 0 86 167 200 0 0 0 0 0 343 622 776 986 1090 1130 1130 0 0 0 0 0 0 0 0 220 345 440 430 Agar Type Str A B C D 1 + + + + − 2 + − + + + 3 + + − + + 4 + + + − + The table on the left shows the number of colonies on each type of agar for samples taken at various times after the samples are mixed, then disrupted and plated: 9. From the gene closest to the origin of replication, the order of these genes is: a) d a b c; b) b a c d; c) c a b d; d) d c b a; e) none of the above. 10. True or false. On the basis of this data, gene b is closer to d than it is to c.
