this worksheet
advertisement
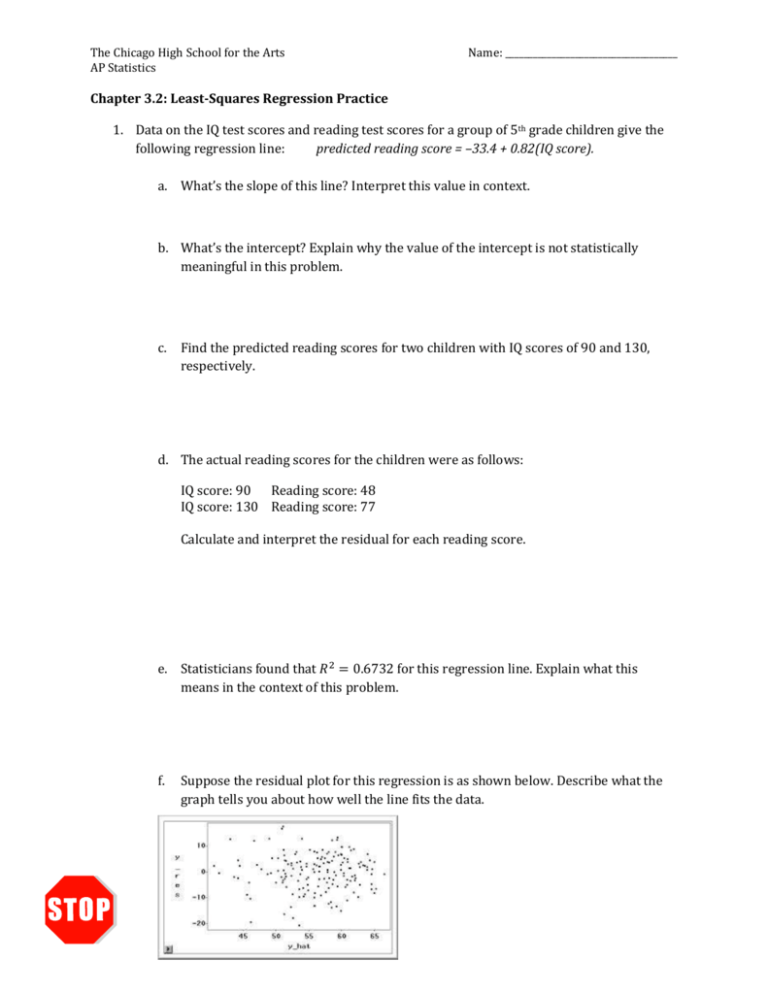
The Chicago High School for the Arts AP Statistics Name: _____________________________________ Chapter 3.2: Least-Squares Regression Practice 1. Data on the IQ test scores and reading test scores for a group of 5th grade children give the following regression line: predicted reading score = –33.4 + 0.82(IQ score). a. What’s the slope of this line? Interpret this value in context. b. What’s the intercept? Explain why the value of the intercept is not statistically meaningful in this problem. c. Find the predicted reading scores for two children with IQ scores of 90 and 130, respectively. d. The actual reading scores for the children were as follows: IQ score: 90 Reading score: 48 IQ score: 130 Reading score: 77 Calculate and interpret the residual for each reading score. e. Statisticians found that 𝑅 2 = 0.6732 for this regression line. Explain what this means in the context of this problem. f. Suppose the residual plot for this regression is as shown below. Describe what the graph tells you about how well the line fits the data. The Chicago High School for the Arts AP Statistics Name: _____________________________________ 2. Lean body mass, given in kilograms, is a person’s weight leaving out all fat. Metabolic rate, in calories burned per 24 hours, is the rate at which the body consumes energy. Data for lean body mass and metabolic rate for 12 women who were subjects in a study of dieting are below. Mass: Rate: 36.1 995 54.6 1425 48.5 1396 42.0 1418 50.6 1502 42.0 1256 40.3 1189 33.1 913 42.4 1124 34.5 51.1 41.2 1052 1347 1204 a. Enter the data into your calculator and make a scatterplot. b. Use the calculator command “LinReg(a+bx) L1, L2, Y1” to find the equation of the least-squares regression line (LSRL). Add the line to your scatterplot. (See p. 170-171 for help.) c. Explain in words what the slope of the regression line tells us. d. Another woman has a lean body mass of 45 kilograms. What is her predicted metabolic rate? e. Use your calculator to make a residual plot (see p. 178 for help). Describe what the graph tells us about how well the line fits the data. f. Which point has the largest residual? Explain what the value of that residual means in context. g. For this regression, 𝑟 2 = 0.768 and 𝑠 = 95.08. Explain what each of these values means in this setting. h. Would this LSRL be useful in predicting the metabolic rate for a man whose lean mass is 30.5 kg? Why or why not? The Chicago High School for the Arts AP Statistics Name: _____________________________________ 3. William Gray heads the Tropical Meteorology Project at Colorado State University. His forecasts before each year’s hurricane season attract a lot of media attention. Here are the data on number of named Atlantic tropical storms predicted by Dr. Gray and the actual number of storms for the years 1984 to 2008. Analyze these data. How accurate are Dr. Gray’s forecasts? How many tropical storms would you expect in a year when his preseason forecast calls for 16 storms? What is the effect of the disastrous 2005 season on your answers? Follow the 4-step process. STATE: PLAN: DO: CONCLUDE:


