Quarter 1 Review Answers
Living Environment
Quarter 1 Review
Name:___________________________________
Part A
1. Single-celled organisms are able to maintain internal stability because they
(1) have multiple organ systems
(2) work with other cells
(3) contain structures that perform life functions
(4) carry out photosynthesis to produce food
2. A similarity between humans and many other multicellular animals is that they
(1) occupy the same niche in most food webs
(2) are composed of organ systems
(3) have the same DNA sequences
(4) carry out autotrophic nutrition
3. In order to enter cells and be useful to the body, starch must be
(1) absorbed through the skin
(2) broken down into fats and water
(3) digested into simple sugars
(4) converted to carbon dioxide and ATP
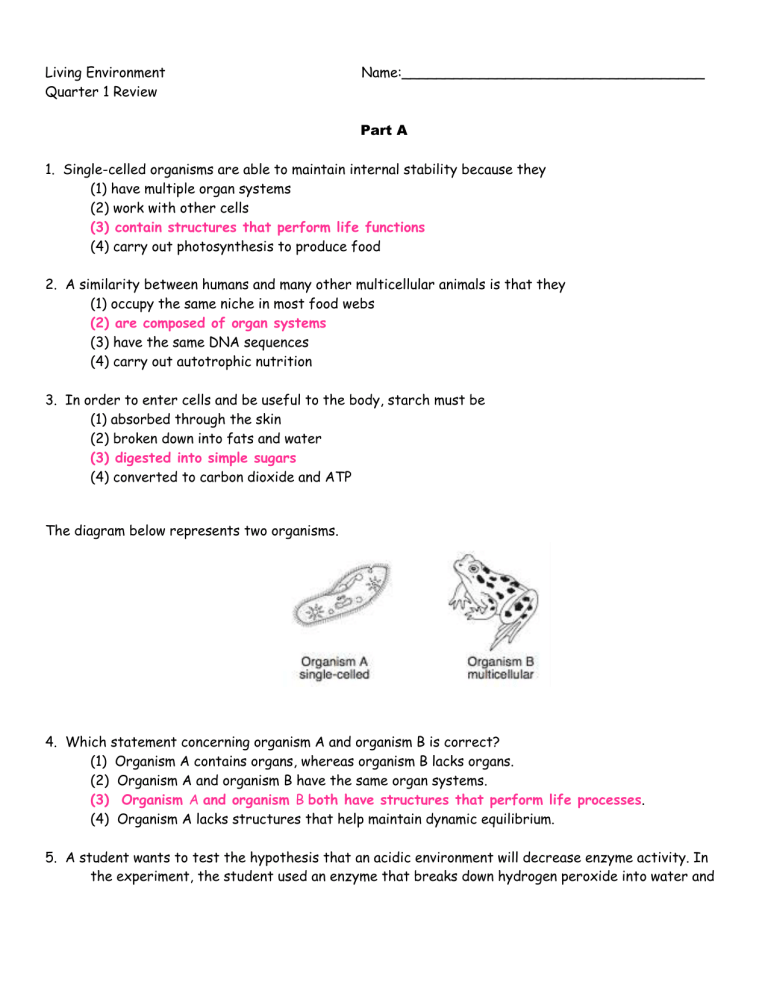
The diagram below represents two organisms.
4. Which statement concerning organism A and organism B is correct?
(1) Organism A contains organs, whereas organism B lacks organs.
(2) Organism A and organism B have the same organ systems.
(3) Organism A and organism B both have structures that perform life processes .
(4) Organism A lacks structures that help maintain dynamic equilibrium.
5. A student wants to test the hypothesis that an acidic environment will decrease enzyme activity. In the experiment, the student used an enzyme that breaks down hydrogen peroxide into water and
bubbles of oxygen. To test the hypothesis, the student should collect data on the number of oxygen bubbles produced at different
(1) temperatures
(3) enzyme concentrations
(2) pH levels
(4) concentrations of hydrogen peroxide
Base your answers to questions 6 through 8 on the information below and on your knowledge of biology.
An experiment was carried out to answer the question “Does the pH of water affect the growth of radish plants?” Two groups of ten radish plants were set up. One group was watered with water having a pH of 3.0, and the other group was watered with water having a pH of 7.0. Both groups of plants received the same amount and intensity of light, the same amount of water, and they were grown in the same type of soil. The heights of the radish plants were measured every 2 days for a period of 2 weeks.
6. Which sentence is a possible hypothesis that was tested in this experiment?
(1) Does the pH of water affect the growth of radish plants?
(2) Will the amount of water alter the heights of the radish plants?
(3) The temperature of the water will affect the heights of the radish plants.
(4) The pH of the water will affect the heights of the radish plants.
7. What was the dependent variable in this experiment?
(1) heights of the plants (3) temperature of the water
(4) type of soil (2) pH of the water
8. Which activity might help to increase the validity of this experiment?
(1) repeating the experiment several times
(2) using two different types of radish seeds in each group
(3) using the same pH for both groups of plants
(4) placing one set of plants in sunlight and one in darkness
The diagram below represents an incomplete sequence of levels of organization.
organelles → tissues → organs → organ systems → organism
9. This sequence can be completed correctly by inserting
(1) “cells → between organelles and tissues
(2) “proteins → between tissues and organs
(3) “populations → between organs and organ systems
(4) “molecules ” between organ systems and organisms
The diagram below represents a model of a biological process that occurs in humans at normal body temperature, 37°C.
10. Increasing body temperature to 40°C would interfere most directly with the rate of function of structure
(1) A
(2) B
(3) C
(4) D
Part B–2
Base your answers to questions 11 through 15 on the information and data table below and on your knowledge of biology.
Daphnia (water fleas) are sensitive to many changes in pond ecosystems. For this reason they are often used in bioassays, tests in which organisms are exposed to various levels of a chemical to determine what levels are safe. The results of these tests determine whether or not the chemical being tested will affect other pond organisms.
An experiment was designed to determine the toxicity of different salt solutions on cultures of daphnia.
Five fish tanks were each filled with the same amount of water containing different concentrations of salt. Ten daphnia were placed into each tank. After 48 hours, the number of daphnia that had survived and the number of daphnia that had died in each tank were recorded and the percent mortality was calculated. The results of the experiment are shown in the data table below.
Directions (11-13): Using the information in the data table, construct a line graph on the grid on the next page, following the directions below.
11. Label the x-axis. Be sure to include units. [1]
12. Mark an appropriate scale, without any breaks, on each axis. [1]
13. Plot the data for mortality on the grid. Surround each point with a small circle and connect the points. [1]
15. Which salt concentration was most toxic to the daphnia in this experiment?
(1) 1.25 g/L (3) 5.0 g/L
(4) 10.0 g/L (2) 2.5 g/L
16. Which salt concentration is most likely closest to the concentration of salt found in the natural environment of this species of daphnia? Support your answer. [1]
Salt concentration:______ 2.5
________ g/L
Part C
Base your answers to questions 17 and 18 on the information below and on your knowledge of biology.
Different plant species require different amounts of direct sunlight in order to flower. A student designed an experiment to determine the length of exposure to direct sunlight necessary for a specific plant species to produce flowers. The student collected the data below.
0 hours, 0% with flowers; 9 hours, 0% with flowers
1 hour, 0% with flowers; 5 hours, 90% with flowers
3 hours, 80% with flowers; 7 hours, 10% with flowers
17. Organize the data collected, from shortest to longest length of exposure, in the data table below. [1]
0
1
3
5
7
9
0
80
90
10
0
0
18. At the end of the experiment, the student stated that if plants are exposed to more hours of daylight, they will always produce a greater percentage of flowers. Is this a valid conclusion? Support your answer. [1]
It is not a valid conclusion because after 5 hours of sunlight the percent of plants with flowers declines. At 9 hours, 0 plants have flowers.
Base your answers to questions 19 through 21 on the information below and on your knowledge of biology.
Ticks, such as deer ticks and dog ticks, feed on the blood of humans and other animals. Part of the feeding process involves the tick injecting its saliva to help make blood flow. In the process, they sometimes spread disease organisms to their host. Sometimes ticks get on clothing, and can remain there for a few days before actually biting their host.
A scientist found that ticks might be able to survive even when exposed to hot water and detergent in a washing machine.
Students designed the experiment below to test how well ticks survive a hot-water washing machine cycle with detergent. Note that some details of the design are incorrect .
19. Identify one error with the hypothesis. [1] It is in the form of a question
20. Explain why the students’ proposed data to be collected would not likely test what the students intended. [1]
It counts the number of ticks that survive the cold water cycle and not the hot water cycle mentioned in the hypothesis
21. Identify one error in the students’ design in the shaded area of the table and explain how the students should change the experiment to correct the error. [1]
Error: test subject are 2 different types of tick set up for the control uses 10 while the experimental uses 100
Correction: pick one type of tick pick one number
Base your answer to question 22 on the information below and on your knowledge of biology.
Some poinsettia plants have green leaves that turn red. A garden club decided to study the color change of poinsettia plants. Knowing that poinsettias change color during the short daylight periods of winter, they decided to investigate the effect of different daylight lengths on color change.
22. Design a controlled experiment using three experimental groups that could be used to determine if the number of hours of daylight has an effect on the color change of poinsettias. In your experimental design, be sure to:
• state one hypothesis the experiment would test [1]
• state one way the three experimental groups would differ [1]
• identify two factors that must be kept the same in all three groups [1] • identify the dependent variable in the experiment [1]
• describe experimental results that would support your hypothesis [1]
Note: The student’s response to the bulleted items in question 64–68 need not appear in the following order.
64 [1] Allow 1 credit for stating one hypothesis the experiment would test. Acceptable responses include, but are not limited to:
— If plants are exposed to fewer than 11 hours of daylight, then they will change color.
— The number of hours of daylight will have no effect on color change.
Note: Do not allow credit for a hypothesis written in the form of a question
Base your answer to question 23 on the information below and on your knowledge of biology.
A student has a sandwich for lunch. The bread contains starch molecules and various other molecules.
After chewing and swallowing some of the sandwich, the starch moves along the digestive system and is digested. The sequence below represents what takes place next. digested starch bloodstream cell cell structure ATP
23. Explain what occurs, beginning with the digestion of starch and ending with ATP production. In your answer, be sure to:
• identify the molecules that are used to digest the starch [1]
• identify the molecules produced when starch is digested [1]
• explain why starch must be digested before its building block molecules can enter the bloodstream [1]
56 [1] Allow 1 credit for identifying the molecules that are used to digest the starch. Acceptable responses include, but are not limited to:
— enzymes
— biological catalysts
— amylase molecules
57 [1] Allow 1 credit for identifying the molecules produced when starch is digested. Acceptable responses include, but are not limited to:
— glucose molecules
— simple sugars
— monosaccharides
— sugars
58 [1] Allow 1 credit for explaining why starch must be digested before its building block molecules can enter the bloodstream. Acceptable responses include, but are not limited to:
— Starch molecules are too large.
— They are too big to get from the digestive tract into the blood.
— Large molecules cannot diffuse through cell membranes.
59 [1] Allow 1 credit for identifying the structure in the cell that will produce ATP from the starch building blocks as the mitochondrion (mitochondria).
60 [1] Allow 1 credit for stating why ATP is important to cells. Acceptable responses include, but are not limited to:
— ATP is the molecule that supplies usable energy for all the activities of a cell.
— ATP molecules provide energy for cells.
Part D
Base your answers to questions 24-25 on the information below and on your knowledge of biology.
Three students took their pulse rates in beats per minute (bpm) while sitting in class. The results are shown in the data table below.
24. State one reason why the pulse rates were not the same for all three students, even though they were all resting at the time. [1]
Everyone is different
25. What is the average pulse rate, in bpm, for this group of students? [1] ______
75
_______bpm

