Figure 1
advertisement
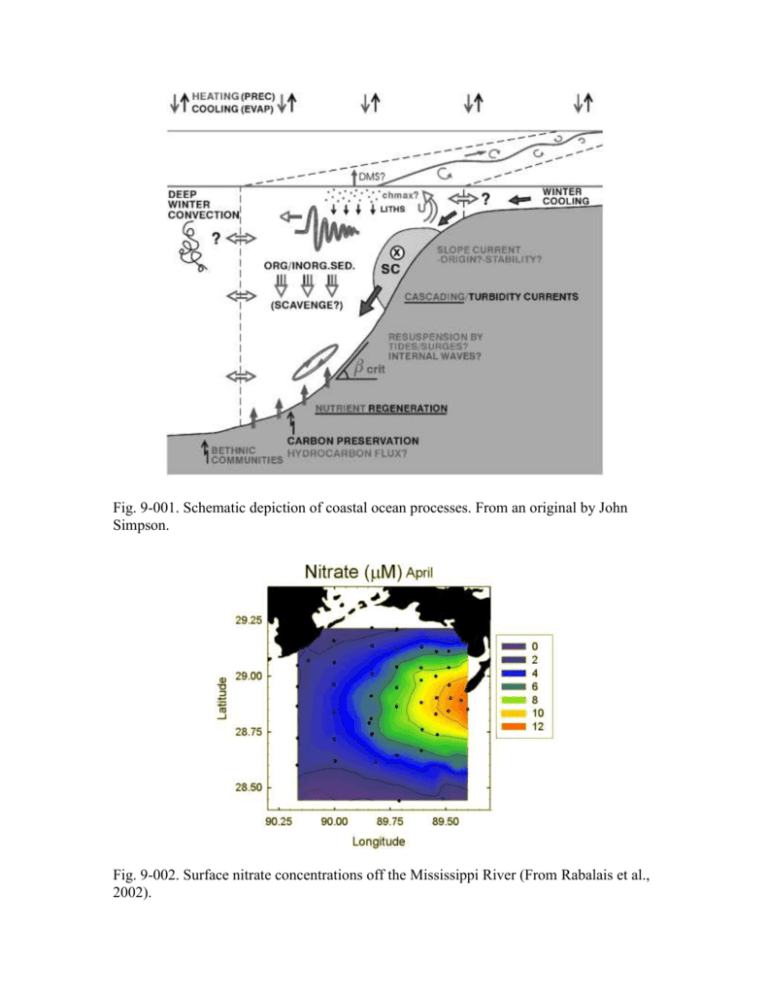
Fig. 9-001. Schematic depiction of coastal ocean processes. From an original by John Simpson. Fig. 9-002. Surface nitrate concentrations off the Mississippi River (From Rabalais et al., 2002). Fig. 9-003. Nitrate section across Gulf Stream. Data from WOCE Section A03. Fig. 9-004. Nitrate flux density distribution for section in 24N across Gulf Stream (From Pelegri and Csanady, 1991). Fig. 9-005. Nitrate section across the Charleston Bump off Charleston, South Carolina (from Singer et al., 1983). Fig. 9-006. Schematic of Gulf Stream frontal eddies and meanders together with shelf flow regimes on the South Atlantic Bight (SAB) (From Lee et al., 1991). Fig. 9-007. Characterization of mean circulation, onshore nitrate flux and sites of potential Gulf Stream-induced new carbon production in the SAB during winter and spring conditions (From Lee et al., 1991). 100 200 200 300 300 400 400 Salinity Temperature 500 100 75 50 25 0 100 75 Oxygen 50 25 0 100 75 50 25 Depth (m) 0 500 0 0 100 100 200 200 300 300 400 400 NO3 500 100 NO2 75 50 25 Distance (km) 0 100 PO4 75 50 25 Distance (km) 0 100 75 50 25 500 0 Distance (km) Fig. 9-008. Vertical/cross-shelf distribution of temperature (°C), salinity (psu), oxygen (ml/l), nitrate, nitrite and phosphate off Coquimbo (30°S), Chile, May 1992. SCORPIO cruise database. Depth (m) Depth (m) 100 Depth (m) 0 0 Fig. 9-009. Schematic upwelling system for the northern hemisphere (From Hill et al., 1998). Fig. 9-010. Surface chlorophyll SeaWiFS image over the Chilean coast, for 9 December 1998 (From Atkinson et al., 2002). Fig. 9-011. Schematic of flow in submarine canyon illustrating data derived characteristic timescales and spatial patterns of alongshelf wind stress, velocity, temperature and vorticity of a maximum upwelling event (From Hickey, 1997).
