exponential growth and decay
advertisement
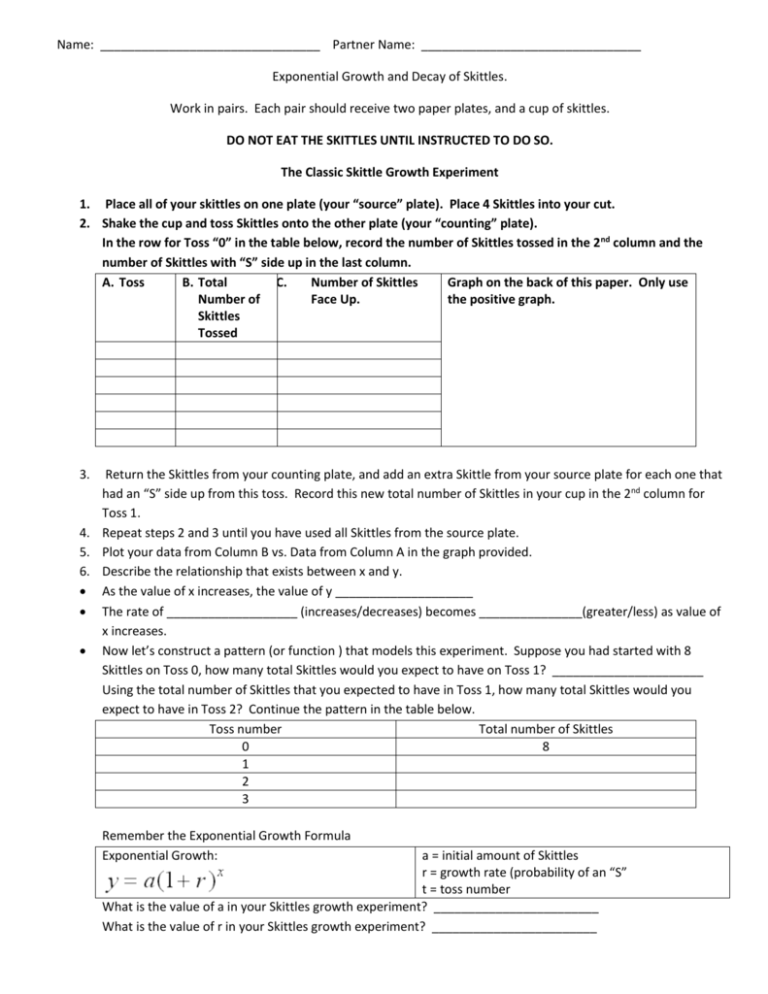
Name: ________________________________ Partner Name: ________________________________ Exponential Growth and Decay of Skittles. Work in pairs. Each pair should receive two paper plates, and a cup of skittles. DO NOT EAT THE SKITTLES UNTIL INSTRUCTED TO DO SO. The Classic Skittle Growth Experiment 1. Place all of your skittles on one plate (your “source” plate). Place 4 Skittles into your cut. 2. Shake the cup and toss Skittles onto the other plate (your “counting” plate). In the row for Toss “0” in the table below, record the number of Skittles tossed in the 2nd column and the number of Skittles with “S” side up in the last column. A. Toss B. Total C. Number of Skittles Graph on the back of this paper. Only use Number of Face Up. the positive graph. Skittles Tossed 3. Return the Skittles from your counting plate, and add an extra Skittle from your source plate for each one that had an “S” side up from this toss. Record this new total number of Skittles in your cup in the 2nd column for Toss 1. 4. Repeat steps 2 and 3 until you have used all Skittles from the source plate. 5. Plot your data from Column B vs. Data from Column A in the graph provided. 6. Describe the relationship that exists between x and y. As the value of x increases, the value of y ____________________ The rate of ___________________ (increases/decreases) becomes _______________(greater/less) as value of x increases. Now let’s construct a pattern (or function ) that models this experiment. Suppose you had started with 8 Skittles on Toss 0, how many total Skittles would you expect to have on Toss 1? ______________________ Using the total number of Skittles that you expected to have in Toss 1, how many total Skittles would you expect to have in Toss 2? Continue the pattern in the table below. Toss number Total number of Skittles 0 8 1 2 3 Remember the Exponential Growth Formula Exponential Growth: a = initial amount of Skittles r = growth rate (probability of an “S” t = toss number What is the value of a in your Skittles growth experiment? ________________________ What is the value of r in your Skittles growth experiment? ________________________ Name: ________________________________ Partner Name: ________________________________ Exponential Growth and Decay of Skittles. Work in pairs. Each pair should receive two paper plates, and a cup of skittles. DO NOT EAT THE SKITTLES UNTIL INSTRUCTED TO DO SO. The Classic Skittle Spill (Decay) Experiment 1. Place all of your skittles on one plate (your “source” plate). Place 4 Skittles into your cut. Shake and toss the Skittles onto your counting plate, and then count the number with “s” side up. Eat all skittles that are not “s” side up. Record both the toss number and number of Skittles remaining on your plate in the table below. D. Toss E. Total F. Number of Skittles Graph on the back of this paper. Only use Number of Face Up. the positive graph. Skittles Tossed 2. 3. 4. Return the remaining Skittles to your cup and repeat step 2 until there are no more Skittles left in your cup. Create a scatterplot of your data in the graph provided. Describe the relationship that exists between x and y. As the value of x increases, the value of y ____________________ The rate of ___________________ (increases/decreases) becomes _______________(greater/less) as value of x increases. Now let’s construct a pattern (or function ) that models this experiment. Suppose you had started with 80 Skittles on Toss 0, how many total Skittles would you expect to have on Toss 1? ______________________ Using the number of Skittles that you expected to land “S” side up in Toss 0, how many would you expect to land “S” side up on Toss 1? Continue the pattern in the table below. Toss number Total number of Skittles 0 80 1 2 3 Remember the Exponential Growth Formula Exponential Decay: a = initial amount of Skittles r = growth rate (probability of an “S” t = toss number What is the value of a in your Skittles decay experiment? ________________________ What is the value of r in your Skittles decay experiment? ________________________
