M 12 M13 and M14 forum posts
advertisement
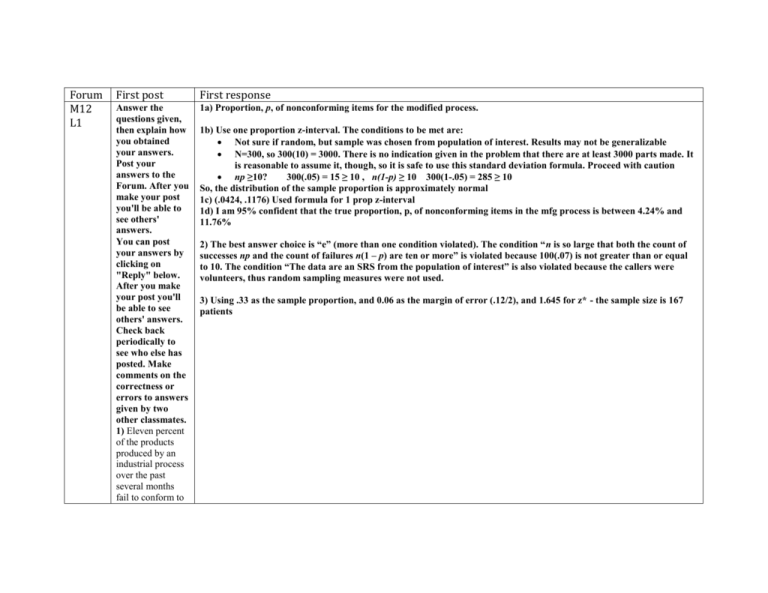
Forum M12 L1 First post First response Answer the questions given, then explain how you obtained your answers. Post your answers to the Forum. After you make your post you'll be able to see others' answers. You can post your answers by clicking on "Reply" below. After you make your post you'll be able to see others' answers. Check back periodically to see who else has posted. Make comments on the correctness or errors to answers given by two other classmates. 1) Eleven percent of the products produced by an industrial process over the past several months fail to conform to 1a) Proportion, p, of nonconforming items for the modified process. 1b) Use one proportion z-interval. The conditions to be met are: Not sure if random, but sample was chosen from population of interest. Results may not be generalizable N=300, so 300(10) = 3000. There is no indication given in the problem that there are at least 3000 parts made. It is reasonable to assume it, though, so it is safe to use this standard deviation formula. Proceed with caution np ≥10? 300(.05) = 15 ≥ 10 , n(1-p) ≥ 10 300(1-.05) = 285 ≥ 10 So, the distribution of the sample proportion is approximately normal 1c) (.0424, .1176) Used formula for 1 prop z-interval 1d) I am 95% confident that the true proportion, p, of nonconforming items in the mfg process is between 4.24% and 11.76% 2) The best answer choice is “e” (more than one condition violated). The condition “n is so large that both the count of successes np and the count of failures n(1 – p) are ten or more” is violated because 100(.07) is not greater than or equal to 10. The condition “The data are an SRS from the population of interest” is also violated because the callers were volunteers, thus random sampling measures were not used. 3) Using .33 as the sample proportion, and 0.06 as the margin of error (.12/2), and 1.645 for z* - the sample size is 167 patients the specifications. The company modifies the process in an attempt to reduce the rate of nonconformities. In a trial run, the modified process produces 16 nonconforming items out of a total of 300 produced. You are to construct a 95% confidence interval for the proportion, p, of nonconforming items for the modified process. 2) A radio talk show host with a large audience is interested in the proportion p of adults in his listening area who think the drinking age should be raised to 25. To find this out he poses the following question to his listeners. “Do you think that the drinking age should be raised to twenty-five in light of the fact that more and more people charged with drunk driving are between the ages of 21 and 24?” He asks listeners to phone in and vote “yes” if they agree the drinking age should be raised and “no” if not. Of the 100 people who phoned in 7 answered “yes.” Which of the following conditions for inference about a proportion using a confidence interval are violated? (a) The data are an SRS from the population of interest. (b) The population is at least ten times as large as the sample. (c) n is so large that both the count of successes n(phat) and the count of failures n(1 – )p-hat)) are ten or more. (d) There appear to be no violations. (e) More than one condition is violated. NOTE: You must explain why your answer is correct 3) Some scientists believe that a new drug would benefit about onethird of all people with a certain degenerative nerve disease. To estimate the proportion of patients who would benefit from taking the drug, the scientists will administer it to a random sample of patients who have the disease. What sample size is needed so that the 90% confidence interval will have a width of 0.12? Justify your answer. M12 L2 Answer the questions given, then explain how you obtained your answers. Post your answers to the Forum. After you make your post you'll be able to see others' answers. You can post your answers by clicking on "Reply" below. After you make your post you'll be able to see others' answers. Check back periodically to see who else has posted. Make comments on the correctness or errors to answers given by two other classmates. 1) In a large 1) “d” - There is significant evidence of a decrease in the proportion of freshmen who graduated in the bottom third of their high school class that were admitted by the university. If you run the test the p-value is .0238 2) “b” = .15 The answer is obtained by .45 - .3 = .15 3) “e” none of the above. The correct standard deviation is 0.0526. This is obtained from the denominator in the formula for the z-statistic for 2 proportion z-tests. P-hat is (X1 + X2)/(n1 + n2). Midwestern university (the class of entering freshmen being on the order of 6000 or more students), an SRS of 100 entering freshmen in 1993 found that 20 finished in the bottom third of their high school class. Admission standards at the university were tightened in 1995. In 1997 an SRS of 100 entering freshmen found that 10 finished in the bottom third of their high school class. Let p1 and p2 be the proportion of all entering freshmen in 1993 and 1997, respectively, who graduated in the bottom third of their high school class. What conclusion should we draw? (a) We are 95% confident that the admissions standards have been tightened. (b) Reject H0 at the = 0.01 significance level. (c) Fail to reject H0 at the = 0.05 significance level. (d) There is significant evidence of a decrease in the proportion of freshmen who graduated in the bottom third of their high school class that were admitted by the university. (e) If we reject H0 at the = .05 significance level based on these results, we have a 5% chance of being wrong. NOTE: you must explain why your answer is correct 2) An SRS of size 100 is taken from a population having proportion 0.45 successes. An independent SRS of size 400 is taken from a population having proportion 0.30 successes. The sampling distribution of the difference in sample proportions has what mean? (a) 0.3 (b) 0.15 (c) The smaller of 0.45 and 0.30 (d) The mean cannot be determined without the sampling results. (e) None of the above. The answer is _______________ ______________. NOTE: you must explain why your answer is correct 3) Using the information you have in problem #2 above, find the standard deviation for the sampling distribution for the difference in sample proportions (a) 1.3 (b) 0.40 (c) 0.047 (d) 0.0002 (e) None of the above. The answer is _______________ ______________. M13 L1 ChiSq Dist In your post, answer the following questions. After you make your post you'll be able to see others' answers. TPOS 2nd edition: Work Problems 13.1, 13.3. TPOS 3rd edition: Work problems 14.1, 14.5. TPOS 2nd Edition: 13.1) This answer is in the back of your book 13.3) In back of book, but the answer below has more information: H0: The tobacco plants fit our expected pattern of 1:2:1. Ha: The tobacco plants do not fit our expected pattern of 1:2:1. Our data are counts. We are evaluating all of the offspring, so our data should be representative of such crosses described. (The observed counts are in L1. The expected frequencies are in L2, and the expected counts are in L3. To obtain the expected counts multiply the values in L2 by the sum of L1.) All expected counts are greater than 5. with 2 degrees of freedom In L4 we calculate the 2 contributions of each category. We find (L1-L3)2/L3. Fail to reject H0, a value this extreme may occur by chance alone more than 6% of the time. We lack strong evidence of a deviation from the expected pattern. We do have some evidence and may wish to recommend that the experiment be repeated with additional data, to be certain of the significance, or lack thereof. TPOS 3rd Edition: #14.1) This answer is in the back of your book. #14.5) This answer is the same as #13.3 above. M13 L1 goodn ess of fit In your post, answer the following questions. After you make your post you'll be able to see others' answers. TPOS 2nd edition: Work Problems 13.11, 13.13 TPOS 3rd edition: Work Problems 14.10, 14.8 TPOS 2nd Edition: #13.11) Step 1: H0: The Trix cereal flavors are uniformly distributed. Ha: The Trix cereal flavors are not uniformly distributed. Step 2: Our data are counts. We are evaluating all of a box of cereal, and that is our population. (We can consider the box to be a random sample of all possible boxes of cereal, but in that case, it is a very small sample.) (The observed counts are in L1. The expected frequencies are in L2, and the expected counts are in L3. To obtain the expected counts multiply the values in L2 by the sum of L1.) Note that since each flavor is expected to be present in an equal amount, each one is expected to be 20% of the total. All expected counts are greater than 5. Step 3: with 4 degrees of freedom In L4 we calculate the 2 contributions of each category. We find . Step 4: The scale doesn't really extend far enough to see the shaded region beyond 47. Step 5: Step 6: Reject H0, a value this extreme will rarely occur by chance alone. Step 7: We have strong evidence that the distribution of flavors in the box of Trix cereal is not uniform. Examining the 2 contributions of each category we see that the third (lime) is underrepresented and the fourth (orange) is overrepresented. These are the largest of the 2 contributions. #13.13) Step 1: H0: The distribution of Parts I through IV are uniform for a carnival game wheel. Ha: The distribution of Parts I through IV are not uniform for a carnival game wheel. Step 2: Our data are counts. We are evaluating a random sample of spins of this wheel. ( (The observed counts are in L1. The expected frequencies are in L2, and the expected counts are in L3. To obtain the expected counts multiply the values in L2 by the sum of L1.) Note that since each part is expected to be present in an equal frequency, each one is expected to be 25% of the total. All expected counts are greater than 5. Step 3: with 3 degrees of freedom In L4 we calculate the 2 contributions of each category. We find . Step 4: The scale doesn't really extend far enough to see the shaded region beyond 24. Step 5: Step 6: Reject H0, a value this extreme will occur less than 1% of the time by chance alone. Step 7: We have strong evidence that the distribution of Parts I, II, III, and IV is not uniform. Examination of the 2 contributions of each category we see that the largest contribution is the overrepresentation of Part IV, the circumstance where the player wins nothing. These results make the wheel appear unbalanced. TPOS 3rd Edition: #14.10) This answer is the same as # 13.11 above #14.8) We want to test Ho: p1 = p2 = p3 = ... = p12 versus Ha: at least one of the proportions differs from 1/12. There were 2779 responses, so we should expect 2779/12 = 231.58 for each sign. The conditions for inference (231.58 > 5) is satisfiied. The chi-squared test statistic is: With a df 12 - 1 = 11, we find from Table D that the p-value is 0.20 < p < 0.25. Using software the p-value is 0.212. There is not enough evidence to conclude that births are not uniformly spread throughout the year. M13 L2 Two way tables In your post, answer the following questions. After you make your post you'll be able to see others' answers. TPOS 2nd edition: TPOS 2nd Edition: #13.15) a) r = the number of rows in the table and c = the number of columns in the table b) Goal Female HSC-HM 0.21 Work Problems 13.15. TPOS 3rd edition: Work problems 14.12. HSC-LM 0.10 LSC-HM 0.31 LSC-LM 0.37 c) Hopefully by now you can create a bar graph that comepares the two genders. If not, then write me or one of your fellow students for help. Remember that when we describe any distribution of categorical data (i.e., a bar chart) then we must talk about what happens the most, what happens the least, and any overall trend. Females participate in sports more than males in the two categories of low social comparison and Males participate in sports more than females in the two categories of high social comparison. Overall it appears that men and women particpate in sports for different reasons. d) Expected Counts: Goal Female HSC-HM 22.5 HSC-LM 12.5 LSC-HM .13 LSC-LM 19 e) For women, the observed counts are higher than expected for the two LSC categories and lower than expected for the two HSC categories. For men, the observed counts are higher than expected for the two HSC categories and lower than expected for the two LSC categories. The comparison of the observed and expected counts shows the same association we noticed with the proportions in parts (b) and (c). TPOS 3rd Edition 14.12) This is the same problem as # 13.15 above. M13 L2 indepe ndenc e In your post, answer the following questions. After you make your post you'll be able to see others' answers. TPOS 2nd edition: Work Problems 13.17 and 13.20. TPOS 3rd edition: Work problems 14.17 and 14.22. TPOS 2nd Edition: 13.17) This answer is in the back of the book 13.20) (a) r=rows =3. c=columns = 2. (b) When both parents smoke, 22.5% of students smoke. (400/(9400+1380)=22.5%) When one parent smokes, 18.6% of students smoke. (416/(416+1823)= 18.6%) When neither parent smokes, 13.9% of students smoke. (188/(188+1168)=13.9%) It looks like the student is more likely to smoke when one or both parents smoke. The rate is highest when both parents smoke. (c) (d) The null hypothesis states that the parents' smoking has no effect on the students' smoking. (e) To find the expected counts enter the data into matrix A and run the 2 test. The recall matrix B to see the expected counts. Expected Counts Both parents smoke One parent smokes Neither parent smokes Student smokes Student does not smoke 332.49 1447.51 418.22 253.29 1820.77 1102.71 (f) There are more than expected students who smoke when both parents smoke, and fewer than expected who smoke when neither parent smokes. We saw these same trends in the earlier parts of this problem when we calculated the proportions of student smokers for each category of parental smoking. TPOS 3rd Edition: #14.17) This answer is in the back of the book #14.22) This is the same as #13.20 above M13 L2 Indepn dence tests (anoth er one M13 L2 indepe ndenc e part 2 No post required In your post, answer the following questions. After you make your post you'll be able to see others' answers. TPOS 2nd edition: Work problem 13.20 again, this time making a 7step writeup. TPOS 3rd edition: Work problems 14.22 again, this time making a 7step writeup. TPOS 2nd Edition: 13.20) 7-step writeup Step 1: H0: Student smoking is independent of parental smoking behavior. Ha: Student smoking is not independent of parental smoking behavior. Step 2: Our data are counts. We are uncertain that our sample is a random one. The expected counts are in Matrix B. All are greater than 5. Step 3: with 2 degrees of freedom Step 4: The scale doesn't really extend far enough to see the shaded region beyond 37. Step 5: Step 6: Reject H0, a value this extreme will rarely occur by chance alone. Step 7: We have strong evidence that the smoking behavior by students is not independent of the parents' smoking behavior. TPOS 3rd Edition: #14.22) This is the same as #13.20 above M13 L3 no post required homog eneity M14 L1 Answer the questions given, then explain how you obtained your answers. Post your answers to the Forum. Note that this time the “correct” answers are not included. The purpose of this exercise is to see how well you do with this concept. You can post your answers by clicking on "Reply" below. After you make your post you'll be able to see others' answers. Check back periodically to see who else has posted. Make comments on the correctness or errors to answers given by two other classmates. 1. Which of the following is NOT one of the basic assumpti ons that must be satisfied in order to perform inference for regression of y on x? a) For each value of x, the corresponding population of yvalues is normally distributed. b) The standard deviation σ of the population of yvalues corresponding to a particular value of x is always the same regardless of the specific value of x. c) The sample size (the number of paired observations (x, y) in the sample data) exceeds 30. d) There exists a straight line y = α + β x such that for each value of x, the mean µy of the corresponding population of yvalues lies on that straight line. 2. If the assumptions for regression inference are met, then a normal probability plot of the residuals should be (a) Bell shaped (b) A group of randomly scattered points (c) Roughly linear (d) Clearly curved 3. If a test of hypotheses rejects H0: β= 0 in favor of the alternative hypothesis Ha: β > 0, where β is the population regression slope, then the leastsquares regression line (a) Slopes downward and to the right when plotted on the scatterplot of paired observations (x, y) (b) Is useful for predicting y given x (within the limits of x-values covered by the data) (c) Can be extrapolated beyond the limits of the x-values covered by the data to predict y at any possible x (d) Is not useful for predicting y given x 4. Inference for regression on the population regression slope β is based on which of the following distributions? (a) The t distribution with n – 1 degrees of freedom (b) The standard normal distribution (c) The chisquare distribution with n – 1 degrees of freedom (d) The t distribution with n – 2 degrees of freedom 5. Suppose that inference for regression is conducted on the following small data set: x 12 14 16 18 y 2 3 5 6 The number of degrees of freedom for our test statistic is (a) 4 (b) 3 (c) 2 (d) Inference cannot be conducted on this data set because it is too small. (e) The answer cannot be determined from the information given. 6. In inference for regression, the statistic s represents (a) The estimate of the standard deviation s in the regression model (b) The standard deviation of the x-values in the paired observations (x, y) (c) The estimate of the yintercept (d) The standard deviation of the y-values in the paired observations (x, y)


