M6 and M7 Forum posts
advertisement
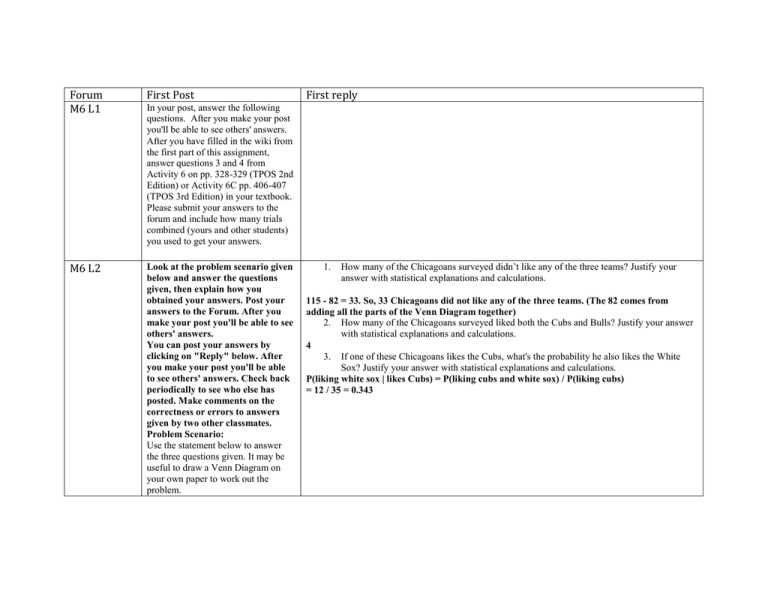
Forum M6 L1 First Post M6 L2 Look at the problem scenario given below and answer the questions given, then explain how you obtained your answers. Post your answers to the Forum. After you make your post you'll be able to see others' answers. You can post your answers by clicking on "Reply" below. After you make your post you'll be able to see others' answers. Check back periodically to see who else has posted. Make comments on the correctness or errors to answers given by two other classmates. Problem Scenario: Use the statement below to answer the three questions given. It may be useful to draw a Venn Diagram on your own paper to work out the problem. First reply In your post, answer the following questions. After you make your post you'll be able to see others' answers. After you have filled in the wiki from the first part of this assignment, answer questions 3 and 4 from Activity 6 on pp. 328-329 (TPOS 2nd Edition) or Activity 6C pp. 406-407 (TPOS 3rd Edition) in your textbook. Please submit your answers to the forum and include how many trials combined (yours and other students) you used to get your answers. 1. How many of the Chicagoans surveyed didn’t like any of the three teams? Justify your answer with statistical explanations and calculations. 115 - 82 = 33. So, 33 Chicagoans did not like any of the three teams. (The 82 comes from adding all the parts of the Venn Diagram together) 2. How many of the Chicagoans surveyed liked both the Cubs and Bulls? Justify your answer with statistical explanations and calculations. 4 3. If one of these Chicagoans likes the Cubs, what's the probability he also likes the White Sox? Justify your answer with statistical explanations and calculations. P(liking white sox | likes Cubs) = P(liking cubs and white sox) / P(liking cubs) = 12 / 35 = 0.343 In a recent survey of 115 Chicagoans, the following information was obtained: 35 liked the Cubs 12 Liked both the Cubs and White Sox 30 liked the Bulls 1 liked all three 55 liked the White Sox 23 liked both the Bulls and White Sox 4 liked only the Bulls 1. 2. 3. M6 L3 How many of the Chicagoans surveyed didn’t like any of the three teams? Justify your answer with statistical explanations and calculations. How many of the Chicagoans surveyed liked both the Cubs and Bulls? Justify your answer with statistical explanations and calculations. If one of these Chicagoans likes the Cubs, what's the probability he also likes the White Sox? Justify your answer with statistical explanations and calculations. Look at the problem scenario given below and answer the questions given, then explain how you obtained your answers. Post your answers to the Forum. After you True or False 1. A simple event has only one possible outcome, whereas a compound event has multiple outcomes. True 2. The sample space contains all the possible outcomes of a compound event. True 3. The closer to 1 the value of a probability is, the less likely it is that the event will occur. make your post you'll be able to see others' answers. You can post your answers by clicking on "Reply" below. After you make your post you'll be able to see others' answers. Check back periodically to see who else has posted. Make comments on the correctness or errors to answers given by two other classmates. Problem Scenario: True or False 1. A simple event has only one possible outcome, whereas a compound event has multiple outcomes. ________ 2. The sample space contains all the possible outcomes of a compound event. ________ 3. The closer to 1 the value of a probability is, the less likely it is that the event will occur. ________ 4. Simple events are always mutually exclusive. ________ 5. Adding up the probabilities of all the simple events in an experiment gives us 1. ________ 6. Compound events are always mutually exclusive. ________ 7. The intersection of two events contains all the outcomes contained in the two events combined. ________ 8. Events that share an intersection are not mutually exclusive. ________ 9. The probability of the union of two events is equal to the sum of the False The closer to 1 the value of a probability is, the more likely it is that the event will occur. 4. Simple events are always mutually exclusive. True 5. Adding up the probabilities of all the simple events in an experiment gives us 1. True 6. Compound events are always mutually exclusive. False Compound events can be either mutually exclusive or not mutually exclusive. 7. The intersection of two events contains all the outcomes contained in the two events combined. False The intersection of two events contains all the outcomes contained in BOTH events. 8. Events that share an intersection are not mutually exclusive. True 9. The probability of the union of two events is equal to the sum of the probabilities of each of the two events. False The probability of the union of two events is equal to the sum of the probabilities of each of the two events, minus the probability of the intersection of the two events. 10. The complement of an event A is the event that A occurs. False The complement of an event A is the event that A does NOT occur. Problem Solving 11. P(less than 3) = P(rolling a 1) + P(rolling a 2) = 1/6 + 1/6 = 2/6 = 1/3 12. We have: P(A) = P(rolling a 1) + P(rolling a3) +P(rolling a 5) = 1/6 +1/6 +1/6 = 3/6 = 1/2 P(B) = 1/3 (calculated above) P(AB) = P(rolling a 1) = 1/6 So P(A∪B) = P(A) +P(B) – P(AB) = ½ + 1/3 – 1/6 = 5/6 – 1/6 = 4/6 = 2/3 13. We have that P(A) + P(complement of A) = 1, so P(A) = 1 – P(complement of A) = 1 - .3 = .6 14. P(A|B) = P(AB)/P(B) = (1/6)/(1/3) = (1/6).(3/1) = ½ 2. probabilities of each of the two events. ________ 10. The complement of an event A is the event that A occurs. _________ Problem Solving 11. Find the probability of getting a number less than 3 when rolling a single six-sided fair die. 12. Find the probability of the union and the probability of the intersection of the following events: A = getting an odd number when rolling a die B = getting a number less than 3 13. If the probability of the complement of A is 0.3, what is the probability of A occurring? 14. Find the conditional probability of A given B, using events A and B from 12 above. M7 L1 random variables In your post, answer the following questions. After you make your post you'll be able to see others' answers. TPOS 2nd edition: TPOS 2nd Edition 7.1) a) P(less than 3) = P(1 or 2) = (2/6) = (1/3). b-c) answers will vary 7.2(a) BBB BGB GBB GGB BBG BGG GBG GGG 1/8 probability each (b) 3/8 Read pp. 487-502. Work problems 9.1, 9.2, 9.3, 9.4, 9.5. TPOS 3rd edition: Read pp. 563-579. Work problems 9.1, 9.2, 9.3 (c) X P(X) 0 1/8 1 3/8 2 3/8 3 1/8 7.3) see back of book for answers. 7.6) (a) P(0 ≤ X ≤ 0.4) = 0.4 (b) P(0.4 ≤X ≤ 1) = 0.6 (c) P(0.3 ≤ X ≤ 0.5) = 0.2 (d) P(0.3 < X < 0.5) = 0.2 (e) P(0.226 ≤ X ≤ 0.713) = 0.487 (f) A continuous distribution assigns probability 0 to every individual outcome. In this case, the probabilities in (c) and (d) are the same because the events differ by 2 individual values, 0.3 and 0.5, each of which has probability 0. TPOS 3rd Edition: 7.1) a) P(less than 3) = P(1 or 2) = (2/6) = (1/3). b-c) answers will vary 7.2) (a) BBB BGB GBB GGB BBG BGG GBG GGG 1/8 probability each (b) 3/8 (c) X 0 1 2 3 P(X) 1/8 3/8 3/8 1/8 7.3) a) (X ≥ 1) or (X > 0). P(X ≥ 1) = 1 – P(X<1) = 1-P(X = 0) = 1 – 0.1 = 0.9 b) The event (X ≤ 2) is “no more than two nonword errors,” or “fewer than three nonword errors.” P(X ≤ 2) = 0.6. P(X < 2) = 0.3. 7.8) (a) P(0 ≤ X ≤ 0.4) = 0.4 (b) P(0.4 ≤X ≤ 1) = 0.6 (c) P(0.3 ≤ X ≤ 0.5) = 0.2 (d) P(0.3 < X < 0.5) = 0.2 (e) P(0.226 ≤ X ≤ 0.713) = 0.487 (f) A continuous distribution assigns probability 0 to every individual outcome. In this case, the probabilities in (c) and (d) are the same because the events differ by 2 individual values, 0.3 and 0.5, each of which has probability 0. M7 L1 law of large numbers In your post, answer the following questions. After you make your post you'll be able to see others' answers. TPOS 2nd Ed: Work problems 7.30, 7.32, 7.34. TPOS 3rd Ed: Work problems 7.31, 7.32, 7.38 TPOS 2nd Edition 7.30 The graph for xmax = 10 displays visible variation for the first ten values of x, whereas the graph for xmax = 100 gets closer and closer to =64.5 as x increases. This illustrates that the larger the sample size (represented by the integers 1,2,3,?in L1), the closer the sample mean gets to population mean. This illustrates the Law of Large Numbers. 7.32(a) The wheel is not affected by previous outcomes - it has no memory; outcomes are independent. So on any one spin, black and red remain equally likely. (b) Wrong. Removing a card changes the composition of the remaining deck, so successive draws are not independent. If you hold 5 red cards, the deck now contains 5 fewer red cards, so your chance of another red decreases. 7.34(a) Independent: Weather conditions a year apart should be independent. (b) Not independent: Weather patterns tend to persist for several days; today's weather tells us something about tomorrow's. (c) Not independent: The two locations are very close together, and would likely have similar weather conditions. TPOS 3rd Edition 7.31)The graph for xmax = 10 displays visible variation for the first ten values of x, whereas the graph for xmax = 100 gets closer and closer to =64.5 as x increases. This illustrates that the larger the sample size (represented by the integers 1,2,3,?in L1), the closer the sample mean gets to population mean. This illustrates the Law of Large Numbers. 7.32) (a) The wheel is not affected by previous outcomes - it has no memory; outcomes are independent. So on any one spin, black and red remain equally likely. (b) Wrong. Removing a card changes the composition of the remaining deck, so successive draws are not independent. If you hold 5 red cards, the deck now contains 5 fewer red cards, so your chance of another red decreases. 7.38) (a) Independent: Weather conditions a year apart should be independent. (b) Not independent: Weather patterns tend to persist for several days; today's weather tells us something about tomorrow's. (c) Not independent: The two locations are very close together, and would likely have similar weather conditions. Graphing Calculator activity and discussion Discussion assessment In your post, answer the following questions. After you make your post you'll be able to see others' answers. TPOS 2nd Ed: Problems 7.1 and 7.6 TPOS 2nd Edition 7.1) a) P(less than 3) = P(1 or 2) = (2/6) = (1/3). b-c) answers will vary 7.2(a) BBB BGB GBB GGB BBG BGG GBG GGG 1/8 probability each (b) 3/8 TPOS 3rd Ed: Problems 7.1 and 7.8 (c) X P(X) 0 1/8 1 3/8 2 3/8 3 1/8 7.3) see back of book for answers. 7.6) (a) P(0 ≤ X ≤ 0.4) = 0.4 (b) P(0.4 ≤X ≤ 1) = 0.6 (c) P(0.3 ≤ X ≤ 0.5) = 0.2 (d) P(0.3 < X < 0.5) = 0.2 (e) P(0.226 ≤ X ≤ 0.713) = 0.487 (f) A continuous distribution assigns probability 0 to every individual outcome. In this case, the probabilities in (c) and (d) are the same because the events differ by 2 individual values, 0.3 and 0.5, each of which has probability 0. TPOS 3rd Edition: 7.1) a) P(less than 3) = P(1 or 2) = (2/6) = (1/3). b-c) answers will vary 7.2) (a) BBB BGB GBB GGB BBG BGG GBG GGG 1/8 probability each (b) 3/8 (c) X 0 1 2 3 P(X) 1/8 3/8 3/8 1/8 7.3) a) (X ≥ 1) or (X > 0). P(X ≥ 1) = 1 – P(X<1) = 1-P(X = 0) = 1 – 0.1 = 0.9 b) The event (X ≤ 2) is “no more than two nonword errors,” or “fewer than three nonword errors.” P(X ≤ 2) = 0.6. P(X < 2) = 0.3. 7.8) (a) P(0 ≤ X ≤ 0.4) = 0.4 (b) P(0.4 ≤X ≤ 1) = 0.6 (c) P(0.3 ≤ X ≤ 0.5) = 0.2 (d) P(0.3 < X < 0.5) = 0.2 (e) P(0.226 ≤ X ≤ 0.713) = 0.487 (f) A continuous distribution assigns probability 0 to every individual outcome. In this case, the probabilities in (c) and (d) are the same because the events differ by 2 individual values, 0.3 and 0.5, each of which has probability 0 Graphing Calculator activity and discussion In this activity, you did 5-10 trials of 200 with your lists. In your post, (1) Give the area of the circle that you found for each trial. So you will be listing 5-10 areas. (2) Compare your areas with other students' areas. You may have to come back later to do this. Using the math you know from before this course, what should the exact area of the circle be? (1) Answers for each trial will vary. (2) The area of the circle should be equal to π, since the radius of the circle is 1 unit, and the formula for the area of a circle is πr2 M7 L1 random Variables In your post, answer the following questions. After you make your post you'll be able to see others' answers. link pdf http://152.46.13.240/MoodleContent/APstats/M7%20L1%20HW%20Answers.pdf M7 L2 Rules for means In your post, answer the following questions. After you make your post Compare your results TPOS 2nd Ed: Problems 7.8 and 7.24 TPOS 3rd Ed: Problems 7.9 and 7.26 TPOS 2nd Edition 7.35) a) Dependent: since the cards are being drawn from the deck without and variances you'll be able to see others' answers. TPOS 2nd Ed: Work problems 7.35, 7.36, 7.37, TPOS 3rd Ed: Work problems 7.39, 7.40, 7.41, replacement, the nature of the third card (and thus the value of Y) will depend upon the nature of the first two cards that were drawn (which determine the value of X) b) Independent: X relayes to the outcome of the first roll, Y to the outcome of the second roll, and individual dice rolls are independent (the dice have no memory). 7.36. The total mean is 40+5+25 = 70 min. 7.38. Assuming that the two times are independent, the total variance is , so . Assuming that the two times are dependent with correlation .3, the total variance is , so . The positive correlation of .3 indicates that the two times have some tendency to increase together or decrease together, which increases the variability of their sum. TPOS 3rd Edition 7.39) a) Dependent: since the cards are being drawn from the deck without replacement, the nature of the third card (and thus the value of Y) will depend upon the nature of the first two cards that were drawn (which determine the value of X) b) Independent: X relates to the outcome of the first roll, Y to the outcome of the second roll, and individual dice rolls are independent (the dice have no memory). 7.40) The total mean is 40 + 5 + 25 = 70 minutes. 7.41) see back of book. M7 L2 Means In your post, answer the following questions. After you make your post for random you'll be able to see others' answers. TPOS 2nd Edition 7.55) The missing probability is 0.99058 (so that the sum is 1). This gives variables TPOS 2nd Ed: Work problems 7.55, 7.56. TPOS 3rd Ed: Work problems 7.55, 7.56. mean earnings of $303.3525. 7.56. The mean μ of the companies "winnings" (premiums) and their "losses" (insurance claims) is positive. Even though the company will lose a large amount of money on a small number of policyholders who die, it will gain a small amount on the majority. The law of large numbers says that the average "winnings" minus "losses" should be close to μ, and overall the company will almost certainly show a profit. In this case it will gain an average of $303.35 per insurance policy. TPOS 3rd Edition 7.55) The missing probability is 0.99058 (so that the sum is 1). This gives mean earnings of $303.3525. 7.56. The mean μ of the companies "winnings" (premiums) and their "losses" (insurance claims) is positive. Even though the company will lose a large amount of money on a small number of policyholders who die, it will gain a small amount on the majority. The law of large numbers says that the average "winnings" minus "losses" should be close to μ, and overall the company will almost certainly show a profit. In this case it will gain an average of $303.35 per insurance policy. M7 Review Read the material below then answer the questions in your post. After you post, you will be able to see others' answers. TPOS 2nd Ed: Read pp. 430-431. Work TPOS 2nd edition AND TPOS 3rd Edition 7.57) The variance is 94,236,826.64 so the standard deviation is the square root of that = $9797.57 problems 7.57, 7.58, 7.61 TPOS 3rd Ed: Read pp. 504-505. Work problems 7.57, 7.58, 7.61 7.58(a) (b) With this new definition of Z: (unchanged), , (smaller by a factor of ) 7.61) see back of book

