M8 and M9 Forum posts
advertisement
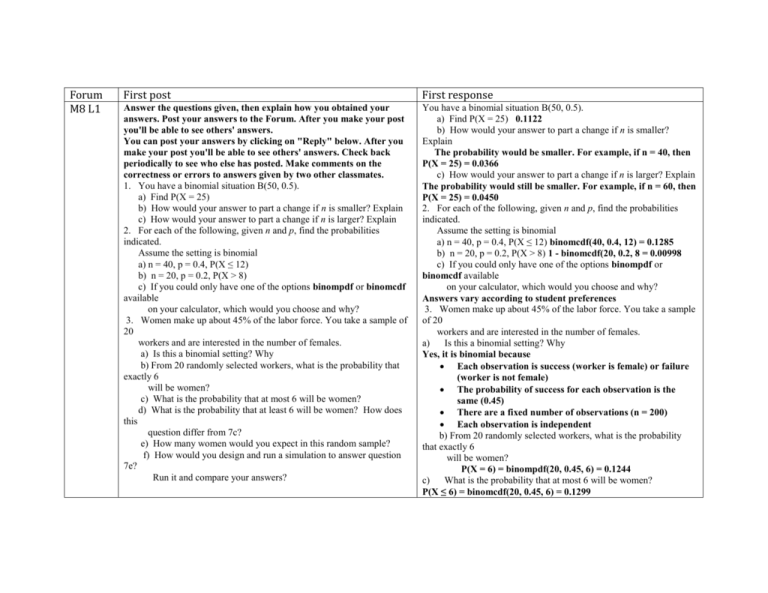
Forum M8 L1 First post First response Answer the questions given, then explain how you obtained your answers. Post your answers to the Forum. After you make your post you'll be able to see others' answers. You can post your answers by clicking on "Reply" below. After you make your post you'll be able to see others' answers. Check back periodically to see who else has posted. Make comments on the correctness or errors to answers given by two other classmates. 1. You have a binomial situation B(50, 0.5). a) Find P(X = 25) b) How would your answer to part a change if n is smaller? Explain c) How would your answer to part a change if n is larger? Explain 2. For each of the following, given n and p, find the probabilities indicated. Assume the setting is binomial a) n = 40, p = 0.4, P(X ≤ 12) b) n = 20, p = 0.2, P(X > 8) c) If you could only have one of the options binompdf or binomcdf available on your calculator, which would you choose and why? 3. Women make up about 45% of the labor force. You take a sample of 20 workers and are interested in the number of females. a) Is this a binomial setting? Why b) From 20 randomly selected workers, what is the probability that exactly 6 will be women? c) What is the probability that at most 6 will be women? d) What is the probability that at least 6 will be women? How does this question differ from 7c? e) How many women would you expect in this random sample? f) How would you design and run a simulation to answer question 7e? Run it and compare your answers? You have a binomial situation B(50, 0.5). a) Find P(X = 25) 0.1122 b) How would your answer to part a change if n is smaller? Explain The probability would be smaller. For example, if n = 40, then P(X = 25) = 0.0366 c) How would your answer to part a change if n is larger? Explain The probability would still be smaller. For example, if n = 60, then P(X = 25) = 0.0450 2. For each of the following, given n and p, find the probabilities indicated. Assume the setting is binomial a) n = 40, p = 0.4, P(X ≤ 12) binomcdf(40, 0.4, 12) = 0.1285 b) n = 20, p = 0.2, P(X > 8) 1 - binomcdf(20, 0.2, 8 = 0.00998 c) If you could only have one of the options binompdf or binomcdf available on your calculator, which would you choose and why? Answers vary according to student preferences 3. Women make up about 45% of the labor force. You take a sample of 20 workers and are interested in the number of females. a) Is this a binomial setting? Why Yes, it is binomial because Each observation is success (worker is female) or failure (worker is not female) The probability of success for each observation is the same (0.45) There are a fixed number of observations (n = 200) Each observation is independent b) From 20 randomly selected workers, what is the probability that exactly 6 will be women? P(X = 6) = binompdf(20, 0.45, 6) = 0.1244 c) What is the probability that at most 6 will be women? P(X ≤ 6) = binomcdf(20, 0.45, 6) = 0.1299 d) What is the probability that at least 6 will be women? How does this question differ from 7c? P(X ≥ 6) = 1 – binomcdf(20, 0.45, 5) = 0.9947 e) How many women would you expect in this random sample? The expected value is the same as the mean of the distribution np = 20(0.45) = 9 f) How would you design and run a simulation to answer question 7e? Run it and compare your answers? One way could be to use a random number table and assign the numbers 00 – 44 to be “success” and 45 – 99 to be “failure”. Read two digits, 20 times and record the number of “successes”. Do this multiple times (say, 10 times) and get an average of successes out of 10 trials. M9 L1 Samplin g Distribu tions In your post, answer the following questions. After you make your post you'll be able to see others' answers. TPOS 2nd edition: Work problems 9.1, 9.2, 9.3, 9.4, 9.5. TPOS 3rd edition: Work problems 9.1, 9.2, 9.3 TPOS 2nd Edition 9.1 answers are in back of book 9.2 p-hat = 7.2% is a statistic. 9.3 answers are in back of book 9.4 Both x-bar = 335 and x-bar = 289 are statistics. 9.5 answers will vary TPOS 3rd Edition 9.1 answers are in back of book 9.2 a) p-hat = 48% is a statistic. p-hat = 52% is a parameter. b) x-bar = 335 and x-bar = 289 are both statistics. 9.3 answers are in back of book M9 L1 Before you post (see below), use your calculator to answer the following questions: 1. Answers will vary, one solution is given: samplin g distribu tions part 2 1. The Bureau of Labor Statistics reports that 25% of people with full-time jobs spend 49 hours or more on the job per week. In a random sample of 20 people with full-time jobs, how many people would be likely to spend 49 or more hours on the job? a) Use randbin to design and run a simulation to answer the question. Run the simulation 100 times. a) b) c) 96% d) 96 people e) The answers are the same. 2. Answers will vary, one solution is given: b) Find the mean and standard deviation of your sampling distribution for the number of people in a sample who spend more than 49 hours per week working. a) b) 96% c) c) Determine the percent of the trials that are within two standard deviations of the mean. d)95.45 and 96% are pretty close! There is only .55% difference 3. RandInt(1,18,20) will produce 20 integers between 1 and 18. RandBin(100,.18,20) will produce the results of 20 binomila experiments with n=100 and p=.18. d) How many people who work full time are likely to spend 49 or more hours on the job each week? (Note: this is where you find the 5th and 95th percentile - like you were shown in the PowerPoint) e) Compare the results in parts (c) and (d). 2. The Marriott Corporation states that about 70% of extended stay travelers (people who stay more than one night at a motel) were under 45 years of age. If a random sample of 20 extended stay travelers is taken at a given hotel, is it likely that there are 17 under 45 years of age? a) Use randBin to design and run a simulation to answer the question. Run the simulation 100 times. b) In a sample of 20, how many extended stay travelers are likely to be under 45 years of age? (Note: this is where you find the 5th and 95th percentile - like you were shown in the PowerPoint)c) What is the theoretical mean and standard deviation of the number of extended stay travelers that are under 45 years of age in a random sample of 20 travelers? d) Use answers to part (c) with normalcdf to estimate the percentage of the trials within two standard deviations of the mean. How does this compare with your answer for part (b)? 3. What is the difference between randInt(1,18,20) and randBin(20,.18,100)? Now click "Reply" and post your answers to questions 1b, 2b, and 3. After you make your post you'll be able to see others' answers. M9 L1 Samplin g distribu tions part 3 Before you post (see below), answer the following questions TPOS 2nd edition: Work problems 9.8, 9.10, 9.11, 9.15. TPOS 3rd edition: Work on problems 9.8, 9.9, 9.10, 9.15 Now click "Reply" and post your answer to question 9.10. After you TPOS 2nd Edition: 9.8 (a). count 9 .045 1 make your post you'll be able to see others' answers. 13 .065 3 14 .070 2 15 .075 5 16 .080 11 17 .085 12 18 .090 12 19 .095 9 20 .100 7 21 .105 5 22 .110 6 23 .115 7 24 .120 10 25 .125 4 26 .130 1 27 .135 2 28 .140 2 30 .150 1 (b) the histogram has a very rough mound shape. The sampling distribution is normal, although this sample of 100 does not strongly suggest it. (c) .0981 the bias seems to be small. (d ) The mean of the sampling distribution should be p=.10. (e) The mean would still be .1, but the spread would be smaller. 9.10(a) large bias ,large variability (b) small bias ,small variability (c) small bias ,large variability (d) large bias ,small variability 9.11 answers are in back of book 9.15 answers are in back of book TPOS 3rd Edition 9.8 Same answers as #9.8 above, TPOS 2nd Edition 9.9 answers are in back of book 9.10 – Same as 9.10 above 9.15 answers are in back of book M9 L1 Penny samplin g In this assignment you will complete Activity 9B from pages 520-521 (TPOS 2nd edition) or pages 596-597 (TPOS 3rd edition), except you will use a computer simulation instead of actual pennies to complete this exercise of sampling pennies. Go to the http://statweb.calpoly.edu/chance/applets/SampleD ata/SampleData.html site and simulate sampling pennies. Follow the general outline from Activity 9B, but allow your sample sizes and numbers to go larger, as time of counting and recording the pennies is not a limitation. Observe and record the sample means for each different sample size. After your pennies simulation, reply to this post and include: 1. A short summary of your sampling distributions for different sample sizes. What trends or patterns do you notice in the sampling distributions? 2. What major statistical principle or idea is illustrated in the Sampling Pennies exercise? Can you explain why this principle might be so useful in practicing statistics? 3. A summary of what you have learned from this exercise. 4. One question you still have about sampling distributions. M9 L2 Samplin g Distribu tions with proporti ons In your post, answer the following questions. After you make your post you'll be able to see others' answers. TPOS 2nd edition: Work problems 9.36, 9.39. TPOS 3rd edition: Work problems 9.36, 9.41 TPOS 2nd Edition 9.36 The mean return x-bar is approximately Normal, with mean μxbar= 13.2% and a standard deviation σx-bar= (17.5)/(√40)=2.7670%. Therefore, P(x-bar > 15%) = P(Z > 0.65) = 0.2578, and P(x-bar < 10%) = P(Z < -1.16) = 0.1230. 9.39 answers are in back of book TPOS 3rd Edition 9.36 answer same as #9.36 above, TPOS 2nd Edition 9.41 answers are in back of book

