Online Resources Online Resource 1 Schematic non
advertisement
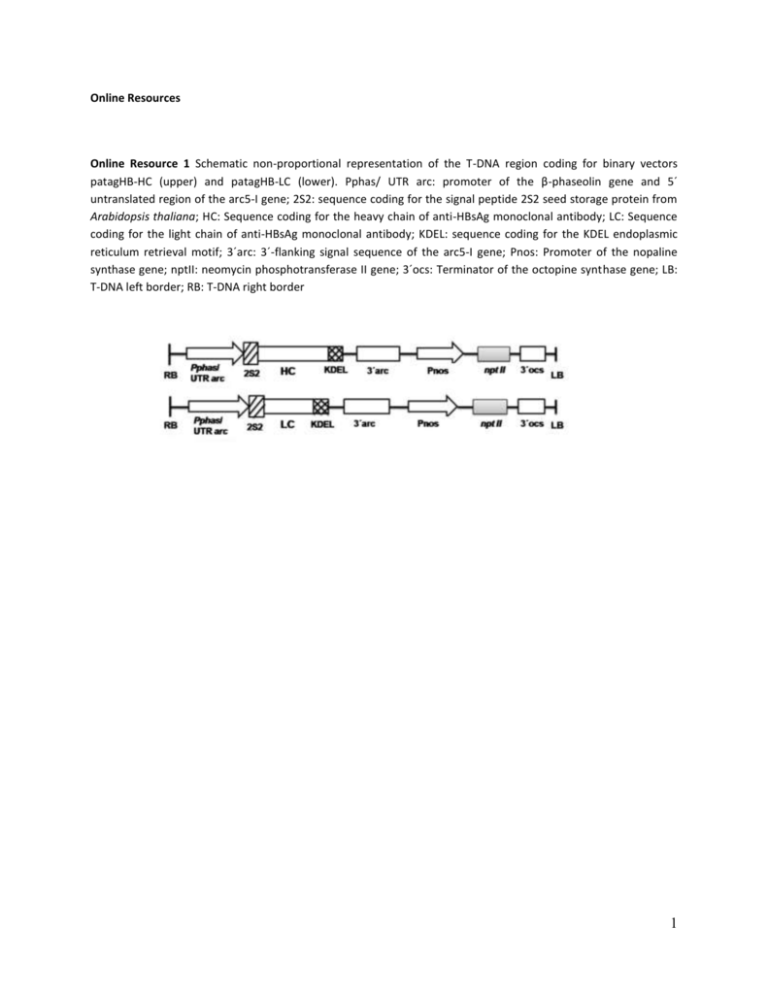
Online Resources Online Resource 1 Schematic non-proportional representation of the T-DNA region coding for binary vectors patagHB-HC (upper) and patagHB-LC (lower). Pphas/ UTR arc: promoter of the β-phaseolin gene and 5´ untranslated region of the arc5-I gene; 2S2: sequence coding for the signal peptide 2S2 seed storage protein from Arabidopsis thaliana; HC: Sequence coding for the heavy chain of anti-HBsAg monoclonal antibody; LC: Sequence coding for the light chain of anti-HBsAg monoclonal antibody; KDEL: sequence coding for the KDEL endoplasmic reticulum retrieval motif; 3´arc: 3´-flanking signal sequence of the arc5-I gene; Pnos: Promoter of the nopaline synthase gene; nptII: neomycin phosphotransferase II gene; 3´ocs: Terminator of the octopine synthase gene; LB: T-DNA left border; RB: T-DNA right border 1 Online Resource 2 Immunodetection of heavy and light chains of PHB-01 produced in tobacco seeds with goat anti-mouse HC (Sigma M8770) + rat anti-mouse LC (Sigma K2132) and rabbit anti-goat IgG peroxidase conjugate (Sigma A5420) + goat anti-rat IgG peroxidase conjugate (Sigma A9037). Lane 1: One-hundred nanograms of PHB01leaf; lanes 2-7: Sixty micrograms of soluble proteins from seed extracts of transgenic lines A10, A35, A50, A68, A83, A91 respectively; lane 8: Sixty micrograms of soluble proteins from seed extracts of an untransformed plant. The main degradation products are indicated (*) 2 Online Resource 3: Yield and purity of the monoclonal antibody PHB-01seed during purification Purity (%)c Yield (%)d 25.0 ± 1.5 78.19 ± 2.26 57.43 ± 4.27 17.1 ± 0.7 93.16 ± 1.13 49.83 ± 3.40 Protein conc. mAb conc. (mg/mL) a (mg/mL) b Seed extract 6.737 ± 0.133 0.174 ± 0.013 700.4 ± 17.3 Prot. A Elution 3.580 ± 0.178 2.803 ± 0.177 SEC-HPLC/ Conc 3.813 ± 0.119 3.553 ± 0.153 Fraction Volume (mL) SEC-HPLC/ Conc: Size exclusion on high performance liquid chromatography TSK G3000 PW and concentration using 10 kDa cut off devices (Millipore, USA). a Determined by BCA. b Determined by ELISA. c Calculated as the ratio of plantibody concentration determined by ELISA, with respect to the protein concentration after each purification step X 100. d Calculated as the ratio of plantibody yield after each purification step with respect to the plantibody yield in original seed extract X 100 . 3 Online Resource 4: Summary of structural assignments from GU values (glucose units) obtained by profiling the Nglycans from PHB-01seed, released by digestion with PNGase A, on an Amide 80 HPLC column. Representation, quantification and classification of N-glycans. Retention Time GU expa GU teob Structure 58.43 3.32 3.46 59.45 3.39 61.8 Representationc (%) Classification M2 4.5 Oligomannosides 3.46 M2 2.3 Oligomannosides 3.54 - - 1.0 No identified 71.79 4.23 4.29 F(3)M2 4.6 Complex (Fucosylated) 74.85 4.48 4.4 M3 4.2 Oligomannosides 80.4 4.92 4.9 M3X 9.9 Complex (Xylosylated) 81.81 5.04 5.06 A1[3] 2.4 Complex (Axyl/ Afuc) 87.76 5.62 5.5 M3XA1 10.6 Complex (Xylosylated) 89.17 5.75 5.74 F(3)A1 1.4 Complex (Fucosylated) 91.31 5.96 5.88 A2X 1.7 Complex (Xylosylated) 4 a 92.43 6.04 5.9 F(3)M3X 3.3 Complex (Xyl/ Fuc) 93.79 6.23 6.19 M5 1.8 Oligomannosides 94.69 6.34 5.28 F(3)A2 5.6 Complex (Fucosylated) 96.64 6.56 - - 1.3 No identified 99.81 6.92 6.85 F(3)A2X 1.8 Complex (Xyl/ Fuc) 101.23 7.09 7.06 M6 D1 6.5 Oligomannosides 107.55 7.92 7.94 M7 29.2 Oligomannosides 113.6 8.83 8.82 M8 5.9 Oligomannosides 117.57 9.48 9.49 M9 1.7 Oligomannosides Glucose Units, experimental (GU exp): Value calculated from the profile on Amide 80-HPLC of N-glycans from PHB-01seed released enzymatically by digestion with PNGase, using standard dextran as ladder. b Glucose Units, theoretical (GU teo): Values reported in GlycoBase, from the Dublin-Oxford Glycobiology Laboratory (http://glycobase.ucd.i.e/cgi-bin/profile_upload. cgi). c N-glycan representation was performed according to Harvey et al. (2009). 5 Online Resource 5 ESI-MS spectrum of underivatized N-glycans from PHB-01seed, released by digestion with Nglycosidase A (PNGase A). All m/z signals correspond to the [M+Na]+ adduct. N-glycan representations follow the conventions of Harvey et al. (2009). Monosaccharide composition was represented as (Man.GlcNAc.Fuc.Xyl). GlcNAc: N-acetylglucosamine, Man: mannose, Fuc: fucose, Xyl: xylose 6


