I572 - I572-Molecular
advertisement
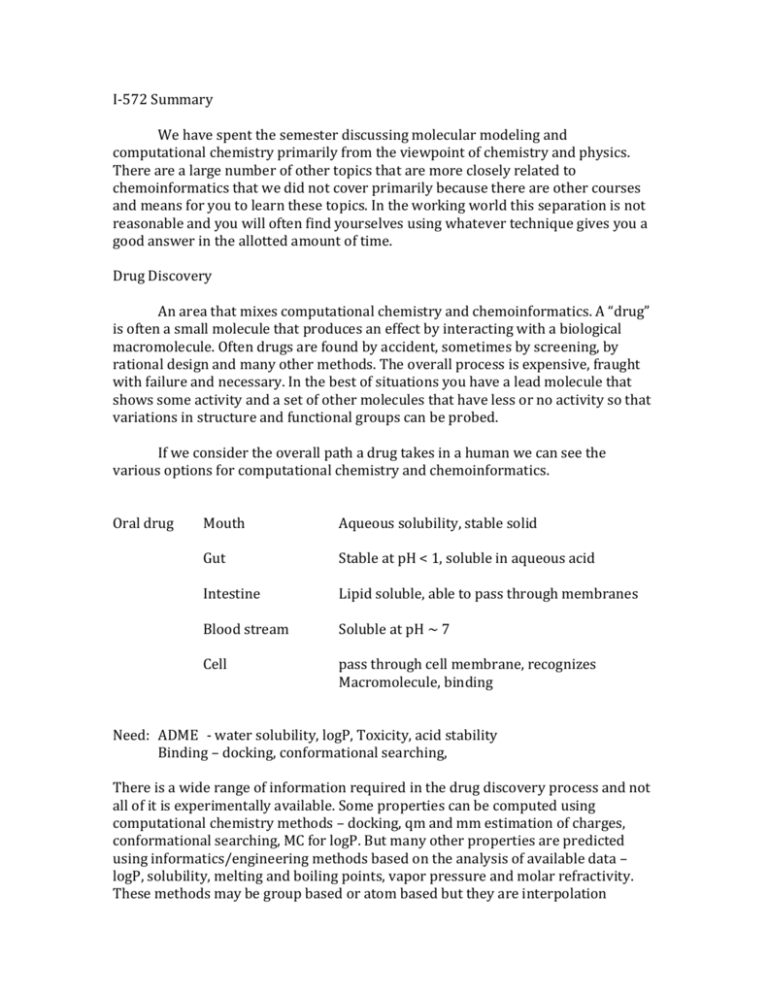
I-572 Summary We have spent the semester discussing molecular modeling and computational chemistry primarily from the viewpoint of chemistry and physics. There are a large number of other topics that are more closely related to chemoinformatics that we did not cover primarily because there are other courses and means for you to learn these topics. In the working world this separation is not reasonable and you will often find yourselves using whatever technique gives you a good answer in the allotted amount of time. Drug Discovery An area that mixes computational chemistry and chemoinformatics. A “drug” is often a small molecule that produces an effect by interacting with a biological macromolecule. Often drugs are found by accident, sometimes by screening, by rational design and many other methods. The overall process is expensive, fraught with failure and necessary. In the best of situations you have a lead molecule that shows some activity and a set of other molecules that have less or no activity so that variations in structure and functional groups can be probed. If we consider the overall path a drug takes in a human we can see the various options for computational chemistry and chemoinformatics. Oral drug Mouth Aqueous solubility, stable solid Gut Stable at pH < 1, soluble in aqueous acid Intestine Lipid soluble, able to pass through membranes Blood stream Soluble at pH ~ 7 Cell pass through cell membrane, recognizes Macromolecule, binding Need: ADME - water solubility, logP, Toxicity, acid stability Binding – docking, conformational searching, There is a wide range of information required in the drug discovery process and not all of it is experimentally available. Some properties can be computed using computational chemistry methods – docking, qm and mm estimation of charges, conformational searching, MC for logP. But many other properties are predicted using informatics/engineering methods based on the analysis of available data – logP, solubility, melting and boiling points, vapor pressure and molar refractivity. These methods may be group based or atom based but they are interpolation methods and only as good as the experimental data base. The purpose of all these methods is too rapidly find new potential drugs and eliminate those molecules which are not likely to be useful. Property Estimation References M. Clark, “Generalized Fragment-Structure Based Property Prediction Methods”, J.Chem.Inf.Model, 2005, 45, 30-38. S.E. Stein and R.L. Brown, “Estimation of Normal Boiling Points from Group Contributions”, J.Chem.Inf.Model, 1994 34, 581-587. R. Wang, Y. Fu, and Luhua Li, “A New Atom-Additive Method for Calculating Partition Coefficients”, J.Chem.Inf.Model, 1997 37, 615-621 T.J. Hou, K. Xia, W. Zhang, and X.J. Xu, “ADME Evaluation in Drug Discovery. 4. Prediction of Aqueous Solubility Based on Atom Contribution Approach”, J.Chem.Inf.Model, 2004 44, 266-275. S. Wildman and G. Grippen, “Prediction of Physiochemical Parameters by Atomic Contributions”, J.Chem.Inf.Model, 1999 39, 868-873. N. Jain and S. Yalkowsky, “Estimation of Aqueous Solublitiy”, J. Pharm. Sci, 90,2001, 234-252. L. Constantinou and R. Gani, “New Group Contribution Method for Estimating Properties of Pure Compounds”, AICHe Journal, 1994, 40, 1697-1710. G. Klopman, J. Li, S. Wang and M. Dimayuga, “Computer Automated logP Calculations Based on Extended Group Contribution Approach”, J.Chem.Inf.Model, 1994 34, 752781. Given a set of active molecules one can construct a 3-D pharmacophore, a set of features common to a series of active molecules arranged in 3D space. The groups normally included would be the standard reactive functional groups – hydrogen bond donors and acceptors, negatively and positively charged groups and hydrophobic regions. These are the groups most likely to interact with the binding site and their arrangement in 3D space usually determines the activity of a particular molecule. Once a pharmacphore is defined it is possible to search a 3D database of molecules looking for new structures that contain the pharmacophore. There are two problems to consider when calculating 3D pharmacophores. First , unless the molecules are all completely rigid, one must take account of their conformational flexibility and the second is to determine which set of pharmacophores is common to all the molecules. It is important to remember that all approaches to finding 3D pharmacophores assumes the molecules all bind in the same manner. One of the most used methods for finding 3D pharmacophores is the constrained systematic search. Starting from the most conformationally restricted molecule you find the lowest energy conformations and identify the positions of the pharmacophore groups. These positions provide restraints which can be used in the conformational searches on the more flexible ligands, eliminating entire regions of conformational space. Only those torsion angles that allow the pharmacophore groups to occupy the same positions as in the first molecule need be checked. As the search on additional ligands proceeds the search space becomes more restricted. Once a 3D pharmacophore has been determined the types of functional groups and the distances between them can be used to search a 3D database of structures for similar types of molecules that satisfy the 3D pharmacophore requirements. The ligands found in the database search can then be analyzed using the various chemoinformatics methods to develop a set of descriptors and these can then be used to predict the various ADME properties and eliminate those ligands that would clearly fail. Finally, given a set of molecules, a set of descriptors and biological activities it may be possible to do a CoMFA analysis. The presumed active conformations of each ligand must be overlaid in the proposed binding site and then the molecular fields surrounding each molecule can then be calculated by placing appropriate probe groups at points on a regular lattice that encompasses the molecule. (Similar to the Grid scoring in Dock). A matrix of grid values (energies) and activities is generated and a correlation between the biological activity and the field values (grid values) is then determined: N P activity C c ij Sij i1 j1 where N is the number of grid points, P is the number of probe groups (+,-,vdw). A partial least squares analysis is done and a coefficient for each column in the table is generated. The value indicates the significance of each grid point in explaining the activity. Such data can then be plotted as 3D contour plots and can be used to identify regions where changes in structure would increase or decrease binding. CoMFA can be particularly useful in the design of compounds that are selective for one target over another, but it has real problems when the binding site or the binding conformation is poorly defined. CoMFA is not the only 3D qsar method available. Drug design is a large field and this has been a very simplified introduction to the topic. I would strongly suggest you obtain a book such as the one by Leach, “Molecular Modeling” and keep it as a reference and starting point for your work in these areas.
