Lab- 3D Model from Topo Map
advertisement
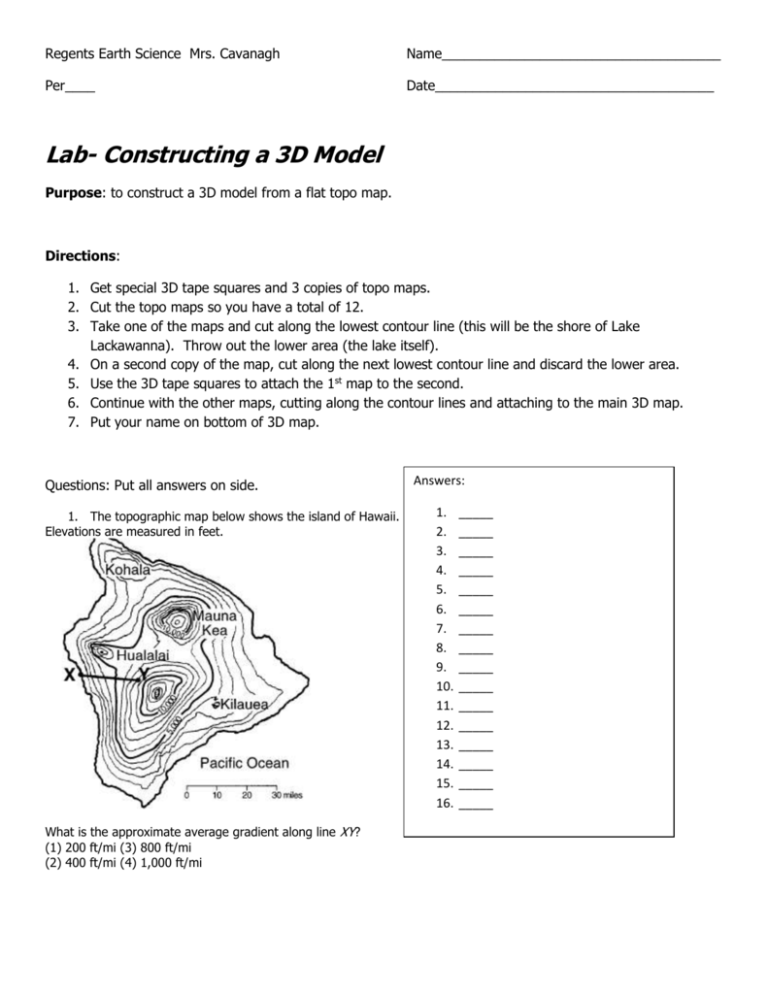
Regents Earth Science Mrs. Cavanagh Name_____________________________________ Per____ Date_____________________________________ Lab- Constructing a 3D Model Purpose: to construct a 3D model from a flat topo map. Directions: 1. Get special 3D tape squares and 3 copies of topo maps. 2. Cut the topo maps so you have a total of 12. 3. Take one of the maps and cut along the lowest contour line (this will be the shore of Lake Lackawanna). Throw out the lower area (the lake itself). 4. On a second copy of the map, cut along the next lowest contour line and discard the lower area. 5. Use the 3D tape squares to attach the 1st map to the second. 6. Continue with the other maps, cutting along the contour lines and attaching to the main 3D map. 7. Put your name on bottom of 3D map. Questions: Put all answers on side. 1. The topographic map below shows the island of Hawaii. Elevations are measured in feet. What is the approximate average gradient along line XY? (1) 200 ft/mi (3) 800 ft/mi (2) 400 ft/mi (4) 1,000 ft/mi Answers: 1. 2. 3. 4. 5. 6. 7. 8. 9. 10. 11. 12. 13. 14. 15. 16. _____ _____ _____ _____ _____ _____ _____ _____ _____ _____ _____ _____ _____ _____ _____ _____ Base your answers to questions 3 through 6 on the Earth Science Reference Tables and the topographic map below. The topographic map represents elevation contours measured in meters. Four straight lines, AB, CD, EF, and GH, have been drawn for reference purposes. 3. What could be the elevation of point X? (1) 819 m (3) 841 m (2) 826 m (4) 850 m 4. Which profile below most likely represents cross sectionGH? 5. What is the general direction of flow of Mill Creek? (1) east to west (3) north to south (2) west to east (4) south to north 6. Between which two locations is the gradient approximately 15 meters per kilometer? (1) A and B (3) C and D (2) E and F (4) G and H Base your answers to questions 7 through 11 on the topographic map below. Letters A through F represent locations on the map. 7. What is the contour interval of this map? (1) 10 m (3) 100 m (2) 50 m (4) 150 m 8. Toward which direction does Moody Creek flow (1) southwest (3) northeast (2) northwest (4) southeast 9. Which location has the lowest elevation? (1) A (3) C (2) E (4) D 10. What is the approximate length of the railroad tracks shown on the map? (1) 15 km (3) 8 km (2) 12 km (4) 4 km 11. Which diagram best represents the profile along a straight line from point D to point C? Base your answers to questions 12 through 16 on the Earth Science Reference Tables, the topographic map below, and your knowledge of Earth science. Points A, B, X, and Y are locations on the map. Elevations are shown in feet. 12. In which general direction is Elm Brook flowing? (1) southwest (2) southeast (3) northwest (4) northeast 13. What is the approximate elevation of the triangulation point on the top of Rock Hill? (1) 124 ft (2) 139 ft (3) 144 ft (4) 169 ft 14. Which diagram best represents the topographic profile along a straight line from point A to point B? 15. Which side of Center Hill has the steepest slope? (1) north (2) south (3) east (4) west 16. What is the average gradient along a straight line between point X and point Y? (1) 30 ft/mi (2) 40 ft/mi (3) 60 ft/mi (4) 70 ft/mi
