Graphing Solubility: Temperature & Saturation Worksheet
advertisement
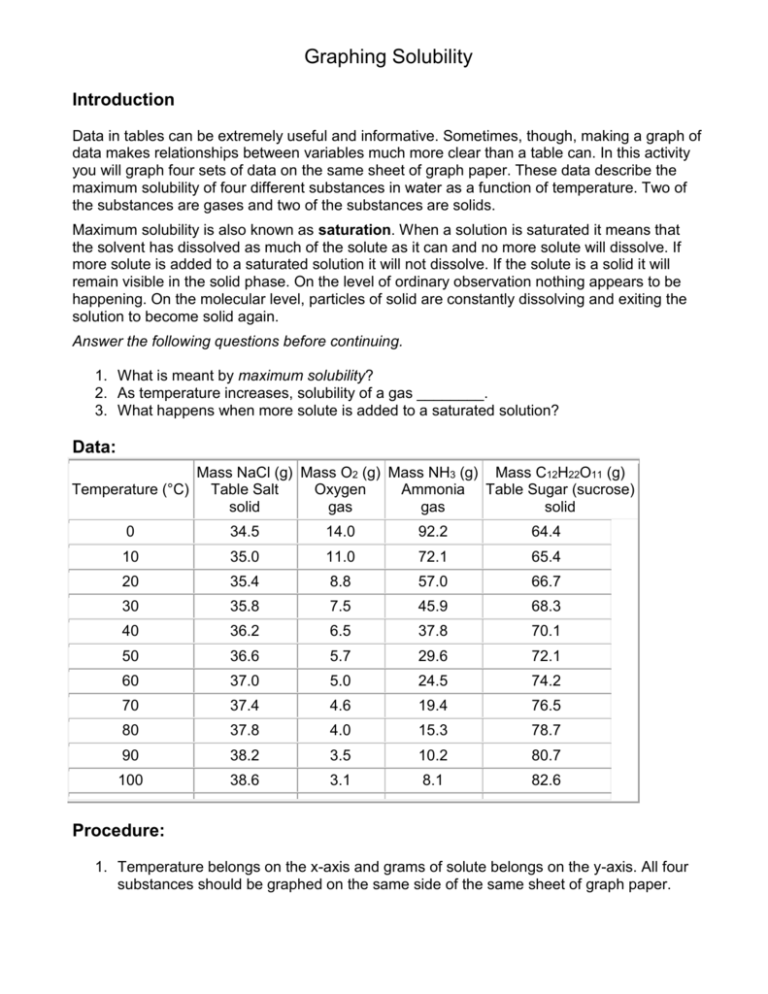
Graphing Solubility Introduction Data in tables can be extremely useful and informative. Sometimes, though, making a graph of data makes relationships between variables much more clear than a table can. In this activity you will graph four sets of data on the same sheet of graph paper. These data describe the maximum solubility of four different substances in water as a function of temperature. Two of the substances are gases and two of the substances are solids. Maximum solubility is also known as saturation. When a solution is saturated it means that the solvent has dissolved as much of the solute as it can and no more solute will dissolve. If more solute is added to a saturated solution it will not dissolve. If the solute is a solid it will remain visible in the solid phase. On the level of ordinary observation nothing appears to be happening. On the molecular level, particles of solid are constantly dissolving and exiting the solution to become solid again. Answer the following questions before continuing. 1. What is meant by maximum solubility? 2. As temperature increases, solubility of a gas ________. 3. What happens when more solute is added to a saturated solution? Data: Temperature (°C) Mass NaCl (g) Mass O2 (g) Mass NH3 (g) Mass C12H22O11 (g) Table Salt Oxygen Ammonia Table Sugar (sucrose) solid gas gas solid 0 34.5 14.0 92.2 64.4 10 35.0 11.0 72.1 65.4 20 35.4 8.8 57.0 66.7 30 35.8 7.5 45.9 68.3 40 36.2 6.5 37.8 70.1 50 36.6 5.7 29.6 72.1 60 37.0 5.0 24.5 74.2 70 37.4 4.6 19.4 76.5 80 37.8 4.0 15.3 78.7 90 38.2 3.5 10.2 80.7 100 38.6 3.1 8.1 82.6 Procedure: 1. Temperature belongs on the x-axis and grams of solute belongs on the y-axis. All four substances should be graphed on the same side of the same sheet of graph paper. 2. Make an easy-to-read graph that fills the space you make available for it (no blank spaces). o This is best accomplished by setting up your axes before you start graphing. o Make sure the largest value to be graphed on each axis will be on the graph. o Select a spacing on the available scale so that you can easily figure out where each decimal is located. 3. Connect the dots for each substance and make each substance have a different color on the graph. Label which color goes with which substance. Questions: Answer these questions on a separate sheet of paper using complete sentences. Show work for all mathematical questions. 1. Which materials increase their solubility as temperature increases? Which materials decrease their solubility? What is the relationship between the state of matter of the solute and the effect temperature has on its solubility in water? 2. Can gases be dissolved in water? What evidence (besides the given data) do you have that gases do dissolve in water? Provide at least two examples from your own experience. 3. In a solution of ammonia at 0°C is there more water present or more ammonia? Justify your answer using the data or your graph. 4. Calculate the number of grams of ammonia that would need to be added to 100 g of water to make a saturated solution at 0°C. 5. Aquatic life requires oxygen to live, just as terrestrial life does. Fish and invertebrates tend to be much more abundant in polar waters than in tropical waters. Given the data you have studied in this activity, explain why this is so. 6. Carbon dioxide is dissolved in water to make soft drinks. Carbon dioxide will dissolve different amounts in water at different temperatures. Which of the curves you drew do you think carbon dioxide will most be like? Explain. 7. People enjoy drinking soft drinks chilled from the refrigerator or with ice. Is there a sound chemical reason for keeping soft drinks cold? What is it? 8. Is there any real advantage in raising the temperature of the solution in order to dissolve more salt (NaCl)? Why or why not? 9. One definition of solute is that it is the substance there is less of in the solution. The solvent is the substance there is more of. Do any of these substances contradict this definition? Prove your answer with some calculations. For each of the following, use your graph to determine if it is a saturated, unsaturated or supersaturated solution. a) b) c) d) 38g of NaCl at 40oC 23g of NH3 at 60oC 10g of O2 at 15oC 72g of C12H22O11 at 49oC e) f) g) h) 3.1g of O2 at 90oC 35g of NaCl at 10oC 60g of NH3 at 20oC 82.6g of C12H22O11 at 100oC
