Lab 8
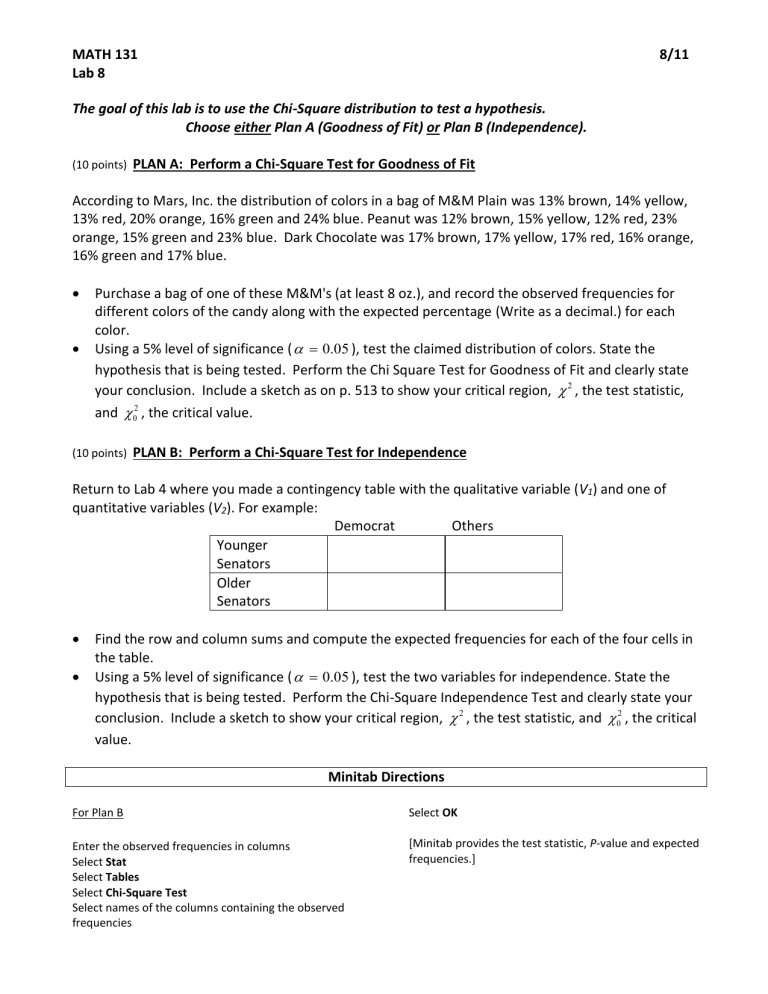
MATH 131
Lab 8
The goal of this lab is to use the Chi-Square distribution to test a hypothesis.
Choose either Plan A (Goodness of Fit) or Plan B (Independence).
(10 points) PLAN A: Perform a Chi-Square Test for Goodness of Fit
8/11
According to Mars, Inc. the distribution of colors in a bag of M&M Plain was 13% brown, 14% yellow,
13% red, 20% orange, 16% green and 24% blue. Peanut was 12% brown, 15% yellow, 12% red, 23% orange, 15% green and 23% blue. Dark Chocolate was 17% brown, 17% yellow, 17% red, 16% orange,
16% green and 17% blue.
Purchase a bag of one of these M&M's (at least 8 oz.), and record the observed frequencies for different colors of the candy along with the expected percentage (Write as a decimal.) for each color.
Using a 5% level of significance (
0.05
), test the claimed distribution of colors. State the hypothesis that is being tested. Perform the Chi Square Test for Goodness of Fit and clearly state your conclusion. Include a sketch as on p. 513 to show your critical region,
2 , the test statistic, and
2
0
, the critical value.
(10 points) PLAN B: Perform a Chi-Square Test for Independence
Return to Lab 4 where you made a contingency table with the qualitative variable (V
1
) and one of quantitative variables (V
2
). For example:
Democrat Others
Younger
Senators
Older
Senators
Find the row and column sums and compute the expected frequencies for each of the four cells in the table.
Using a 5% level of significance (
0.05
), test the two variables for independence. State the hypothesis that is being tested. Perform the Chi-Square Independence Test and clearly state your conclusion. Include a sketch to show your critical region,
2 , the test statistic, and
2
0
, the critical value.
Minitab Directions
For Plan B
Enter the observed frequencies in columns
Select Stat
Select Tables
Select Chi-Square Test
Select names of the columns containing the observed frequencies
Select OK
[Minitab provides the test statistic, P-value and expected frequencies.]

