Guide Book - Geology Rocks @ Canon Slade!
advertisement
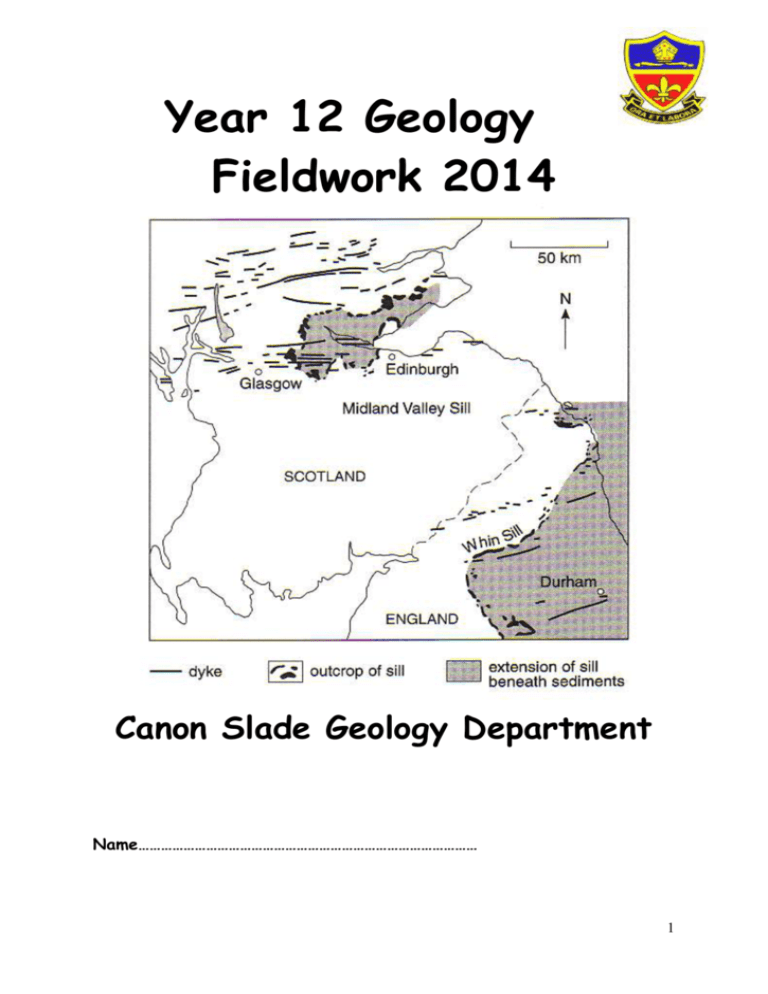
Year 12 Geology Fieldwork 2014 Canon Slade Geology Department Name……………………………………………………………………………… 1 2 Regional Geology Map of Northern England Day 1 Ingleton Day Aims: 1. Record observations on the changes in rock type and mineralogy in the Ingleton area on a field map and field notebook. 2. Trace and determine a fold structure using strike and dip measurements. 3. Make a summary geological map of the Ingleton area to show the boundaries of the different rocks and structures present. 4. See at first hand, and explain, how unconformities are formed. The area you are visiting today is known as the Ingleton Inlier (an area of older rocks surrounded by much younger rocks). We will be observing the rocks and structures in this area by following the Ingleton Glens Waterfall Walk as shown in the map below. The Twiss and Doe Rivers have eroded through younger Carboniferous limestones to expose the much older rocks of Lower Palaeozoic age (Yorkshire's oldest rocks to date). 3 75000 74000 4 69500 70000 Working out the puzzle from the past: Reflective Questions 1. At site one in Swilla Glen which way did the rocks dip and by how much? Dip Direction……………………… Angle……………………….. 2. What lithology are the rocks at sites one and 2?................................... You can now colour in your first outcrop and add your structural data, Sir will show you how. 3. At site two in Swilla Glen which way did the rocks dip and by how much? Dip Direction……………………… Angle……………………….. Add this structural data to your map 4. What type of fold do you cross as you walk from sites one to two?........................................... 5. Using a dashed line you can now add the fold axial plane trace to the map. 7. What force must have caused this fold?............................. and from which directions? .......-…… 8. Explain the features of geological interest at site 3? No add any structural and lithological information to your map. 9. What type of rocks are exposed at site four?............................................. 10. What might have caused a change in lithology between here and locality three?...................... 11. What evidence did you record in your notebook for the answer to question 10? 12. What lithology outcrops at the quarry at site five?................................................. 13. Explain how these rocks were originally deposited? 14. What evidence is there of tectonic movement in these rocks since deposition? 15. Explain with a diagram the type of geological structure seen in these rocks? 5 Now add the lithologies and structural data to site five. 16. What would the use of these quarried rocks have been?.......................................... 17. What lithology outcrops at locality six and seven?.......................... Now add it to the map along with any structural data. 18. On Cookoo Island, site 8 what sedimentary structures did you notice? 19. How were they formed and what type of sequence do they represent? 20. Are these rocks the correct way-up? You can now add the structural data and lithology information to your map for site eight. 21. What rock type occurs at site nine?.................................. How can you be sure?.............................. What is its dip………………………………………………… 22. If you look at the map a spring line occurs at about 225m on the over side of the valley (east). Using your knowledge of site 9 and site 8 can you explain the presence of the spring line? - A sketch will help. You can now mark any lithological and structural data on the map for site nine. 23. Look at your sketch you made of Thornton Force from site ten. What do you notice about the rocks above and below? 24. What type of geological structure is this and how can you be even more certain (use the information you gained from going behind the waterfall i.e. what was found directly above the vertically dipping rocks?) 25. What does the boundary between the two rocks represent (2 things) 6 If the conglomerate above the steeply dipping rocks represent the beach deposits of a transgressing sea during sea level rise, what must the rock below once have been? 26. Explain the full order of events that must have formed this feature. 27. What lithology is exposed at site 11……………………………? Finally add it and any structural data to your map. 28. In the space below, or at the side of the map, make a stratigraphic column to represent the order of deposition of the rocks. If the rocks are of a different age then the boxes don’t follow on and are shown by a wavy line (unconformity). Make a key below for structural data too. 29. At Raven Ray, just above site nine there is an exposure of a terminal moraine at the head of Kingsdale at the end of the last Pleistocene Glaciation (10, 000 years ago). Explain what effect this had on the drainage of the River Twiss and the formation of Thornton Force and the Gorge (Glen) it left to the South. Some common symbols used on geological maps: 7 Cow Green Mapping: Day 2 Aims: Now that you are experienced in making observations and deductions in the field, we want to give you the opportunity some real field mapping. We will visit an area near Cow Green Reservoir in Upper Teesdale. You should make full field notes and sketches in your field notebook, concentrating on the following objectives: 1. Identify the lithologies in the area 2. Produce a geological map of the area. 3. Attempt to draw a geological cross-section and explain the geological history of the area. 8 High Force and Low Force Area: Day 3 Aims To record the lithologies present Record Dip and Strike and map area Write a geological history of the area. To make a graphic log of the sediments at Bowlees if time permits Key: WS= Whin Sill S = Metamorphosed Carboniferous Sandstone TBL = Tyne Bottom Limestone 9 10 Map 1: Blank Base Map Cow Green Map 2: High and Low Force Field Sites 10 01 8 9 5 7 1 6 Key: 1 = The Leap (nr Scooberry Br); 2 = S bank 3; = Waterfall 4 = Outcrop S bank; 5 = View from S to N bank Shelf; 6 = Outcrop S side; 7 = Outcrop S side; 8 = Staple Crag 9 = LF from Wynch Br 10 = High force; 11 = Holwick Scars 3 4 2 11 01 89 90 91 92 93 94 11 Map 3: Cow Green Field Sites 1 2 3 4 5 11? 6 7 9 8 10 Key: 1 = Weelhead Syke CP; 2 =View Back to CP; 3 Rod’s Vein; 4 = Pile of Stones; 5 = Red Syke; 6 = Cow Green Dam; 7 = Top of Caldron Snout; 8 = Foot of Cauldron Snout; 9 Falcon Clints; 10 = Small rubbly 12Scar outcrop 11 = Cronkley 13 Geological Timescale Eon Era Period Ma (millions of years ago) 0 Quaternary 2 2 Cenozoic Geological Environment in the Lake District ‘Ice Age’ with 11 cold phases or glacials Tertiary 65 65 Cretaceous 142 142 Jurassic 206 206 Mesozoic Triassic 249 249 Permian 290 290 Phanerozoic (visible life) Carboniferous 354 354 Devonian 417 417 Palaeozoic Silurian 443 443 Ordovician 495 495 Cambrian 545 545 Cryptozoic Desert & semi-arid conditions with Britain 15ºN of the Equator (similar to the location of the present day Sahara desert) Equatorial climate with Britain lying on the Equator giving warm shallow seas & on the delta areas lush tropical vegetation Desert & semi-arid conditions with Britain 20ºS of the Equator (similar to the location of the present day Kalahari desert) Initially tropical shallow marine conditions, followed by deepening seas due subsidence Subduction of the Iapetus Oceanic crust forming explosive volcanoes, followed by the collision of the Laurentian & Avalonian continents Deposition of sediments by turbidity currents in deep water on the continental slopes of the former Iapetus Ocean Pre-Cambrian (hidden life) 4600 14 Fieldwork Skills 1. Use of the compass clinometer to measure dip and strike Before going into the field you need to know how to use your compass clinometer. The compass clinometer is a single instrument used to measure strike and dip directions of rock beds, as well as their dip angles. The device has two needles for measuring angles. The double-ended magnetic needle (white one end and red & white the other end), which is free to swing only when the baseplate is held horizontally, is used for determining strike relative to magnetic north. To do this, one edge of the baseplate is held pointing along the strike and the dial is rotated until 0° (north) lines up with the north end (red & white end) of the compass needle. The strike (in degrees round from magnetic north) can then be read off against the small fixed arrowhead marked on the hinge of the mirror and baseplate. 2. Turn the dial until the north arrow lines up with the north end of the compass needle 1. Point the edge of the compass along the strike 3. Read off the strike direction from the dial here Measuring Strike To measure the dip of a surface you must use the other needle, which is a single-ended object that points downwards under its own weight, and only works when the baseplate is held vertically on its side. To be able to read this correctly, you must first rotate the compass dial so that 270° (W) lines up with the small fixed arrowhead on the hinge of the mirror and baseplate. When you look at it from the side, you will see that the clinometer scale is now lined up with 90° dip against this arrowhead. To make a measurement, hold the baseplate in a vertical plane (so the clinometer needle can hang freely) and with its long side running directly down the dip (water is often used to find the steepest dip of a bed of rock). The dip angle can be read off where the clinometer needle meets the scale. You must read the dip angle off the scale while the clinometer needle is still in its vertically hanging position. 1. Turn the compass dial until 270° (W) lines up the arrowhead here 2. Hold the compass vertically with the long side running down the dip 3. Read the dip angle off where the clinometer needle meets the scale here Measuring Dip 15 You will be measuring strike from magnetic north, which differs by a few degrees from true (grid) north. You should record strike and dip in your notebook in the following style. For example, a strike of 220° with a dip of 20° approximately towards the southeast should be recorded 220/20SE; always use three digits for the strike and two digits for the dip, and omit the degree symbols because in handwriting these can be mistaken for zeroes. A strike of 40° should be recorded as 040. Note that 040° differs from 220° by 180°, and so records the same orientation of strike (it does not matter which way we look along the strike of a bed of rock). 220/20SE and 040/20SE therefore are alternative ways of describing the strike and dip of the same plane. You should write down whatever strike you read off your compass, and not attempt to add or subtract 180° because there is a chance you will make a mistake! For plotting on a map, it is recommended that 220/20SE should be shown as: 20 The longer line indicates the strike direction and the tick mark shows the down-dip direction. The dip direction is taken in a very similar way to the method of measuring the strike. The only difference being that the dip direction is a one direction measurement not a two direction measurement like strike. So you must point the mirror end of the compass in the direction of dip and then turn the compass dial until the magnetic needle is above the north arrow. Next read off the angle at the small arrowhead, just as you did for the strike. 2. Turn the dial until the north arrow lines up with the north end of the compass needle 1. Holding the compass flat, point the mirror end of the compass down the dip 3. Read off the strike direction from the dial here Measuring Dip Direction If you cannot remember what strike and dip mean then take a look at the diagram below! 16 2. Recording field data in a field notebook One of the most important aspects of fieldwork is observation, and recording as much of what you see as possible, so that you can refer to it later. This is more important than trying to suggest complicated interpretations of what you see. Beware of jumping to conclusions too soon. a) Taking notes: To obtain maximum benefit from fieldwork, you have to take accurate notes in the field. This is essential, whether you are an experienced geologist or beginner. Good field notes provide a store of information on which you can draw on later when writing up your coursework. Don’t forget your notebooks are handed in and assessed as part of your coursework! We suggest you adopt a standard format for your notetaking: it is worth checking and re-checking the list of data you should record at each locality, because this is the only way of making sure that you do not forget to record anything. Each day, start by noting the date and general area to be visited. Then at each locality record the information indicated in the table below. Note that all features may not be relevant to every locality but are included for completeness. Checklist for field notes: 1 Locality/Site 2 3 Sketch Photographs Rock Lithology 4 Bedding 5 Tectonic Structures 6 Fossils 7 Other and Grid reference, locality name/number & written description Overall sketch & close up sketches with annotations Texture (crystalline, fragmental, chemical) Minerals present (grain size, shapes & sorting) Rock identification & description Measure strike & dip of beds Thinly or thickly bedded? Any minor features or structures, e.g. ripples marks? Joints Faults Record strike & dip if present Folds Cleavage or foliation Note abundance & variety of fossils & trace fossils Do not destroy fossils Note any obvious features, such as mineral veins & any cross-cutting relationships Obviously this is a list predominantly for sedimentary rocks, but you will find that much of it also applies to igneous and metamorphic rocks. Remember to keep checking this list to make sure you have recorded all the necessary details. b) Making field sketches: Field sketches always form an important part of any field notes. The best sketches are not perfect artistic drawings; the idea is that they should show accurately the significant large-scale geological features of an outcrop accurately. To make best use of your sketches you should annotate them extensively. Don’t forget to include a rough scale and a north point as well as to label or number any more detailed sketches in your field notebook. The very act of sketching (even if you are not very good 17 at it) should make you think about interpreting the geology of the area you are examining. c) Taking photographs: Remember to record the details (the shot numbers/file numbers) for each locality. Some digital cameras allow you to record a voice note with each picture. This would be a very handy tool for working out what you have taken when you start writing up your coursework after the field trip has finished. Photographs are not a substitute for a field sketch. 18 Diagram 1: Mineral ID Flow Diagram 19 Diagram 2: Sedimentary Rocks Description Card 20 Diagram 3: Metamorphic Rocks Description Card 21 Diagram 4: Igneous Rocks Description Card 22 Diagram 5: Flow diagram showing Procedure for collection of primary data Whenever you see a new outcrop of rock stand back (10-20m depending on size & locality) and take stock of the general structure. Number the locality/site. Give it a grid reference & very briefly describe the location. Draw a sketch & take a photograph. Look for & label on your sketch any of the following: Is the rock all the same colour, texture & shape, or does it look like there may be more than one rock type? Weathering will often help pick out subtle differences in rock type by changes in colour, texture or shape. Are there any regular planar (straight) features running through the rock? Are there any other unusual or irregular features that strike you about the outcrop? If there are, these may be bedding, cleavage, jointing, or faulting. These might be due to folding, faulting, hydrothermal veins or igneous intrusions? Then step up to the outcrop for a closer look. Sketch & photograph all the features seen. Give these a number on your overall sketch. Find a fresh surface of rock & look very closely at the rock (use a hand lens) Oops, go back & start again! No Yes Does the rock have cleavage? Can you see the minerals or grains by eye? Yes No Are the minerals too small to see? Yes Does the rock have crystals in bands? Yes No No Are the minerals glassy & interlocking? Yes No It is METAMORPHIC No Will the rock powder when scratched with metal? It is IGNEOUS It is SEDIMENTARY Yes Does the rock fizz in HCl? No Yes It is a LIMESTONE It is SEDIMENTARY 23 Now describe & name the rock by using the separate rock identification charts Diagram 6: Criteria for distinguishing lava flow from a sill Lava Flow Has one baked margin Usually fine grained May have vesicles / amygdales due to degassing at surface May have a red-brown weathered surface (red bole) due to sub-aerial weathering. May contain fragments of the lava flow in the rocks above due to sub-aerial weathering Columnar joints present tend to be more slender at the surface where cooling was fast but become wider and more monotonous with depth due to uniform cooling – called colonnade columns. Unlikely to find cooling joints in county rock below Lava flow top surfaces may be more likely to form glassy margins due to more rapid cooling. Lava flows may record pillow structures. Lava flows may form flow bands. Sill Has two baked margins Often medium grained No vesicles as not degassed (as intrusive) Less likely to have heavily weathered surface unless been exposed due to removal of sediment cover. Columnar joints tend to be more regular in sills due to uniform cooling. Cooling joints may be visible in 2m or so of the country rock above and below the sill as they too were intensely heated on cooling and cooled down and contracted. Sills may show signs of transgression within the country rock as they follow lines of weakness. Diagram 7: Sedimentary Rocks Classification 24 AS Coursework Coursework: For your AS level Geology coursework you must submit at 1 piece of fieldwork. Coursework is worth 30% of your AS year and is completed in your own time rather than under examination conditions. Consequently it is very important to do as good a job as possible on these pieces of work. On the next 2 pages is the format that these pieces of coursework should follow. YOUR COURSEWORK IS YOUR RESPONSIBILITY AND WILL NOT BE MARKED UNLESS YOU FOLLOW THE CORRECT LAYOUT AND COMPLETE THE PLANNING SHEETS. IT MUST ALSO BE ALL OF YOUR OWN WORK! THIS MEANS YOU MUST REFERENCE SOURCES USED. NO SUBMISSION WILL THEREFORE MEAN YOU RECEIVE ZERO FOR 33% OF THE YEAR. Layout: Must submit with AS GL2a 2 planning sheet (wjec website) and AS GL2b 2 form (wjec website) Point 10 Text Black (comic Sans MS, Times New Roman or Ariel); Justify Text; Use line spacing 1.5 in paragraph tool. Page numbers included bottom right Header on each page centred to include: Your name; candidate number; school name; investigation title. Front page to include the same as the header (can also include cover sheet) Contents page (optional – but useful to organise work) Staple or bind together neatly, please no document wallets or plastic sheets or it won’t be marked. Name; School and Candidate Number to go on field note book and on all field sketches. All of the above needs to go into a cardboard file (provided by Sir). Plan: Is your plan written in the future tense (e.g. I will measure....)? Introduction and location map -Where are you going to undertake the study? - From preliminary research why is this a good area? What is there to study. Show evidence of research / background reading. Use the regional geology map. – Consider a preliminary study (this could be of another site – what did you learn from this that you would do next time in your main project?). Discuss the regional and local geology to set the context of your study. Aims/hypotheses: - Set an overall project aim / research question / title or problem you will investigate in your project (can be changed later and ideas can be recorded in your plan) - Make some hypothesis based on your background research. These can be numbered. 25 Justification of hypotheses using background geological knowledge based on you AS notes / reading. Why have you chosen these to test / investigate? What will your predicted outcome of the project / investigation be? Method of data collection Explain the primary sources of data you intend to use what will you need to collect? How will you collect it (flow chart 7) and why is this the best method linking back to your aim / hypothesis? How will you describe the rocks and minerals (diagrams 2-4). The best projects are the ones which make clear reference to how you have tailored your plan to the research question being investigated. E.g. If you expect to be dealing with mainly metamorphic rocks or mainly fossils, show how data on these would be described and collected first. What secondary sources are you going to use / base your project on? (books, internet other research? Equipment needed Can be done using a table or paragraphs and must include a justification of why it was needed. Again the best investigation write-ups link the specialist equipment needed to the title being investigated. What sampling techniques will you use? Why these? Why are you going to do it this way rather than other ways? How will you ensure accurate and reliable results? Data presentation How are you going to present your results? E.g. field sketches (how will this be done), photos, graphs (what type – draw out examples of the type you will use), tables, spread sheets, sketch maps, base maps etc.. Keep explaining how and why each will be used – link back to aim. Method of analysis How will you analyse sketches, models, photos, graphs, cross sections, geological maps, base maps, sketch maps. Limitations/assumptions? Think about any problems you might encounter before you start. How might these be overcome? Safety considerations What specific safety considerations did you take into account with reference to your method to allow you collect data safely? E.g. working near water? In mountainous areas etc. Implementation: In order to provide evidence for implementation, it is vital that the appropriate field notes from your note book are included with the report. Ideas of how to improve your field notes include: 26 Each field sketch should have a six-figure grid reference, scale, compass orientation and detailed annotations. Simplistic labelling of sketches is not good enough! Field notes should consist of detailed observations, measurements and records made by you in the field. Make comments about the reliability of the data being collected and any limitations or assumptions being made. Do this in your notebook as you work through your investigation and this will help later when writing your evaluation. The field notes provide the basis for the final report and should be considered the most important part of the investigation. Analysis: The analysis involves both a description of your findings and an explanation of your findings. Remember to use your AS notes here. 1. A description involves writing out geologically what you found at each site. For example: Site 1: The main rock at this location was crystalline in texture as the crystals were interlocking at not fragmental. No pore spaces could be seen. The rock was very hard and was very light in colour. No bedding structures or layering could be seen so no dip directions or angle measurements could be taken, although a number of widely spaced (5 to 10cm) joints were apparent. The whole body of rock was discordant with the surrounding country rock. The minerals were randomly orientated and were on average 2 to 3 cms in size, making it coarse grained. There were three minerals visible. The white rectangular mineral had a vitreous lustre and could not be scratched by a metal blade, making it >5.5 in hardness. Probably making it feldspar. etc....... 2. An explanation for this description would involve the following: The crystalline rock with randomly orientated minerals suggests an igneous origin cooling and solidifying from molten rock. The large crystal size (>2mm) suggests the magma was cooled slowly at depth and probably represents a batholith. The discordant nature of its boundary with the surrounding country rock also back this up. The light colour (felsic) of this coarse grained igneous rock suggests it is acidic with respect to its silica content, probably >65% SiO2. The white mineral was plagioclase feldspar due to its hardness, colour and shape, whilst the hard glassy mineral is probably quartz, and the black soft mineral is biotite mica. These minerals and the coarse grain size suggest it to represent a granite. Once you have described and explained the findings at each site, you need to interpret your findings with respect to the wider context of the investigation. What do all the results at each of the sites investigated tell you about the whole area? Can you work out the geological history or order of formation? Conclude your analysis by referring back to your initial question or hypothesis stating whether it was correct or not. Extension? • Has your analysis raised any further questions or hypothesis that could be tested (i.e. extensions to your project) Going further (A grade coursework)! Once an intrusive nature for the Whin Sill at in the Upper Teesdale has been established by your field observations there remain other problems connected with it which arise from further field evidence, but which are, as yet, difficult to explain. From the map on the cover it can be seen that the Whin Sill outcrops over a 150km length and extends eastwards underneath Durham towards the North Sea. With thicknesses varying between 5 and 70 metres, an average of around 25 metres, you can appreciate that the Whin Sill involves a considerable volume of igneous material (look at question). You can work out its volume to show this. But how did it achieve this lateral 27 extent and continuity? It would be straightforward if we could think of it melting and burning its way through the bedded rocks of the Carboniferous limestones etc., making use of planes of weakness such as faults and folds in the strata, but the evidence collected from the field suggests that contact temperatures were relatively modest. The metamorphic alterations above and below the sill extend to only a limited distance away from the contacts. Also from observations and laboratory experiments, dolerite magmas are not a fluid as erupted basalts, so, the question arises, how did the sill manage to penetrate a lithified succession of sediments, and even disrupt rocks to the extent that large rafts of sediment can be included in the sill? If you also need to bear in mind that this intrusion took place beneath an overlying pile of approximately 4,000 metres of Carboniferous sediments, then we have "space problem", i.e. how did it make space for itself? The space problem and the mechanical power to displace remain to be explained. Any ideas?? You could also think about is there any evidence for its transgression apart from at the Falcon Clints? Try and piece days one and two together. The sill is above the Tynebottom limestone at High Force, but between the Melmerby Scar Limestone at Cauldron Snout – research the stratigraphic order of these units and explain. Other extensions could include looking for evidence how the sill was emplaced at Staple Crag and trying to deduce the significance of this site. Evaluation: This last section involves answering a number of questions about your investigation. How reliable was your method? Were there any problems or difficulties you came up against? How reliable do you think your data is? Are there any anomalies that you didn't expect? Can you explain them? You could evaluate your interpretations of each field locality as you go along in your analysis. How could you improve your investigation if you were to carry it out again? What further study does this investigation lead you onto? Who might your findings be of use to? Evaluation is not a list of excuses. Naive and simplistic statements regarding lack of time, bad weather, phases of the moon and lack of familiarity with equipment do not form the basis of a mature evaluation. As a rough guide, one side of A4 word-processed text is a probable optimum length for evaluation. A bibliography of sources used and any acknowledgements of any help gained should also be included. 28

