Practice Quiz: Food Webs and Energy Pyramids Name: .__ 1. The
advertisement
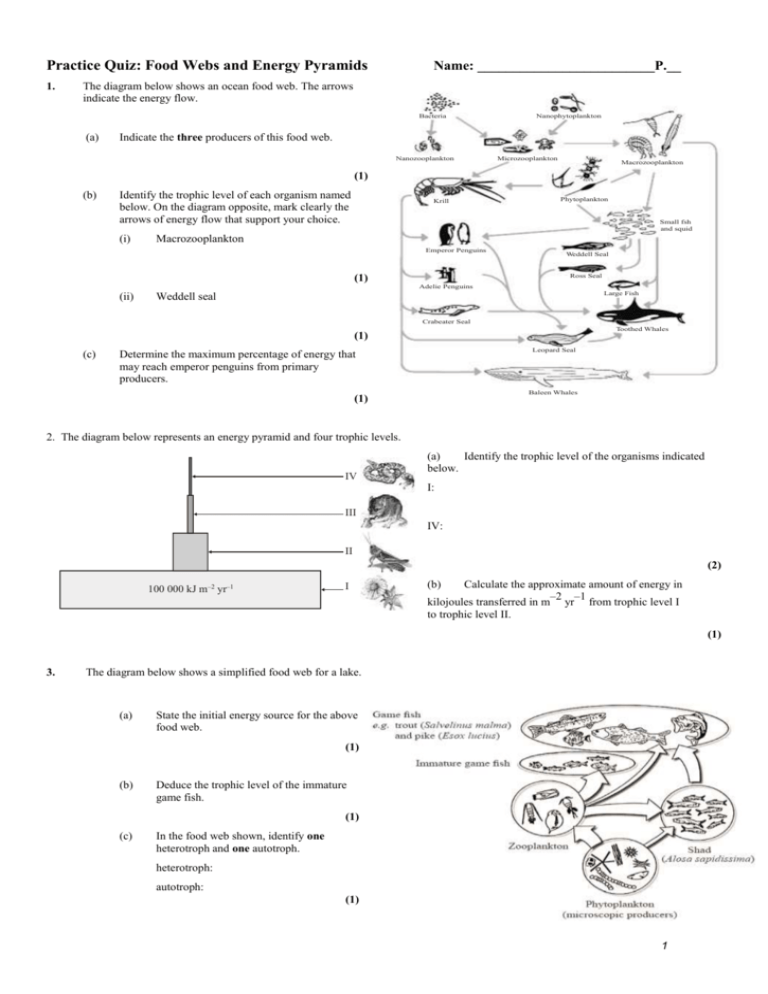
Practice Quiz: Food Webs and Energy Pyramids 1. Name: _________________________P.__ The diagram below shows an ocean food web. The arrows indicate the energy flow. Bacteria (a) Nanophytoplankton Indicate the three producers of this food web. Nanozooplankton Microzooplankton Macrozooplankton (1) (b) Identify the trophic level of each organism named below. On the diagram opposite, mark clearly the arrows of energy flow that support your choice. (i) Krill Phytoplankton Small fsh and squid Macrozooplankton Emperor Penguins (1) Weddell Seal Ross Seal Adelie Penguins (ii) Large Fish Weddell seal Crabeater Seal Toothed Whales (1) (c) Leopard Seal Determine the maximum percentage of energy that may reach emperor penguins from primary producers. Baleen Whales (1) 2. The diagram below represents an energy pyramid and four trophic levels. IV (a) Identify the trophic level of the organisms indicated below. I: III IV: II (2) 100 000 kJ m–2 yr–1 I (b) Calculate the approximate amount of energy in –2 –1 kilojoules transferred in m yr from trophic level I to trophic level II. (1) 3. The diagram below shows a simplified food web for a lake. (a) State the initial energy source for the above food web. (1) (b) Deduce the trophic level of the immature game fish. (1) (c) In the food web shown, identify one heterotroph and one autotroph. heterotroph: autotroph: (1) 1 4. This diagram represents a simple food chain. In which ways is energy lost between the trophic levels? I. II. III. A. I and II only B. I and III only C. II and III only D. I, II and III Heat loss through cell respiration Material not consumed Material not assimilated (1) Sea water temperature has an effect on the spawning (release of eggs) of echinoderms living in Antarctic waters. Echinoderm larvae feed on phytoplankton. In this investigation, the spawning of echinoderms and its effect on phytoplankton was studied. In the figure below, the top line indicates the number of larvae caught (per 5000 litres of sea water). The shaded bars below show when spawning occurred in echinoderms. = 0 % to 25 % = 25 % to 75 % = 75 % to 100% The concentration of chlorophyll gives an indication of the concentration of phytoplankton. Note: that the seasons in the Antarctic are reversed from those in the northern hemisphere. Number of echinoderm larvae (a) 80 0 State the trophic level of echinoderm larvae. % Spawning of echinoderm (1) (b) Identify the period during which the spawning of echinoderm lies between 25% and 75%. (1) 2 1 0 –1 –2 Sea temperature / °C 100 (c) Explain the relationship between the seasons and the concentration of phytoplankton. (2) Log10 Chlorophyll concentration / mg m–3 10 1 0.1 0.01 Dec (d) (i) phytoplankton Mar Jun 1993 Sep Dec Mar Jun Sep 1994 Dec Outline the effect of sea water temperature on echinoderm larvae numbers. (2) Total /17 2 Sea temperature /°C 5.

