started with BMElib
advertisement

BMELIB
Numerical Library for Bayesian Maximum Entropy space/time estimation
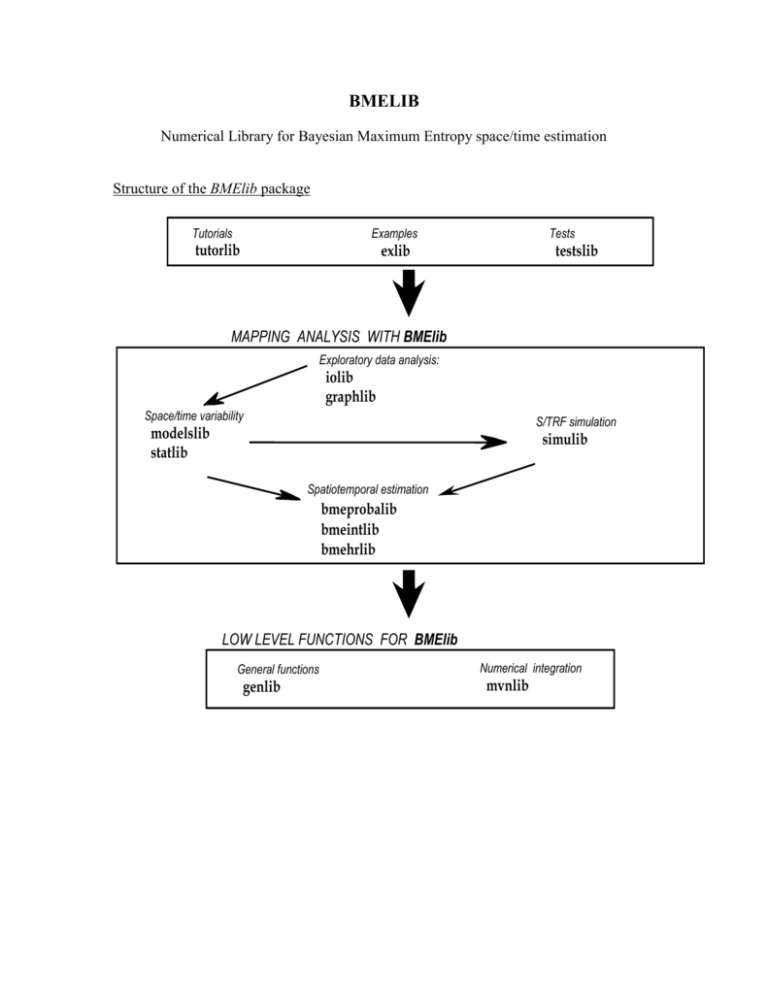
Structure of the BMElib package
Tutorials
Examples
tutorlib
Tests
exlib
testslib
MAPPING ANALYSIS WITH BMElib
Exploratory data analysis:
iolib
graphlib
Space/time variability
S/TRF simulation
modelslib
statlib
simulib
Spatiotemporal estimation
bmeprobalib
bmeintlib
bmehrlib
LOW LEVEL FUNCTIONS FOR BMElib
General functions
genlib
Numerical integration
mvnlib
The different directories of BMELIB:
iolib exploratory data analysis, file input/output
graphlib exploratory data analysis, graphical functions
modelslib - analysis of space/time variability, variogram and covariance models
statlib analysis of space/time variability, statitics and estimation of variograms
bmeprobalib - spatiotemporal estimation, using hard data and probabilistic soft data
bmeintlib
spatiotemporal estimation, using hard data and interval soft data
bmehrlib
spatiotemporal estimation, using hard data only
simulib
simulation of S/TRF realizations
genlib
miscellaneous, general functions
mvnlib
miscellaneous, FORTRAN routines
tutorlib
tutorials
exlib
examples
testslib
test functions
Getting help for on a specific BMELIB directory
» help graphlib
BMELIB exploratory data analysis, graphical functions (Jan 1, 2001)
colorplot
markerplot
poleplot
histscatterplot
stringplot
valplot
probaplot
- plot of values at 2-D coordinates using colormaps
- plot of values at 2-D coordinates using markers
- 3-D perspective plot at 2-D coordinates using poles
- histograms and scatter plots
- plot of text strings at 2-D coordinates
- plot of values at 2-D coordinates using texts
- Plots the probabilistic data
Getting help for on a specific BMELIB function
» help markerplot
markerplot
- plot of values at 2-D coordinates using markers (Jan 1,2001)
Plot the values of a vector at a set of two dimensional coordinates
using symbols of varying sizes such that the size of the displayed
symbols at these coordinates is a function of the corresponding values.
SYNTAX :
markerplot(c,z,sizelim,Property,Value);
INPUT :
c
n by 2 matrix of coordinates for the locations to be displayed.
Each line corresponds to the vector of coordinates at a
location, so the number of columns is equal to two.
z
n by 1 column vector of values to be coded as markers.
sizelim 1 by 2 vector that contains the minimum and maximum values in pixels
for the size of the symbols to be displayed. The minimum and
maximum size values are associated with the minimum and maximum
values in z, respectively. The size of the symbols for values in
between these minimum and maximum are obtained by linear interpolation.
Property 1 by k cell array where each cell is a string that contains a legal name
of a plot object property. This variable is optional, as default
values are used if Property is missing from the input list of variables.
Execute get(H), where H is a plot handle, to see a list of plot object
properties and their current values. Execute set(H) to see a list of
plot object properties and legal property values. See also the help
for plot.m.
Value
1 by k cell array where each cell is a legal value for the corresponding plot
object property as specified in Property.
NOTE :
For example,
markerplot(c,z,sizelim,Property,Value);
where sizelim=[5 20];
Property={'Marker','MarkerEdgeColor','MarkerFaceColor'};
Value={'^',[0 0 1],[1 0 0]};
will plot red triangles with a blue border that have a MarkerSize value between 5 and 20
pixels. By default, markerplot(c,z,sizelim) will use disks with the default properties for
plot.m.
Doing the tutorials
To get help on the tutorial directory:
» help tutorlib
GENLIBtutorial
- tutorial for the genlib directory (Jan 1,2001)
GRAPHLIBtutorial
- tutorial for the graphlib directory (Jan 1,2001)
KRIGLIBtutorial
- tutorial for the kriglib directory (Jan 1,2001)
MODELSLIBtutorial
- tutorial for the modelslib directory (Jan 1,2001)
SIMULIBtutorial
- tutorial for the simulib directory (Jan 1,2001)
STATLIBtutorial
- tutorial for the statlib directory (Jan 1,2001)
BMEINTLIBtutorial
- tutorial for the bmeintlib directory (Jan 1,2001)
To run the graphics directory:
» GRAPHLIBtutorial


