DENSITY LAB - Parkway C-2
advertisement
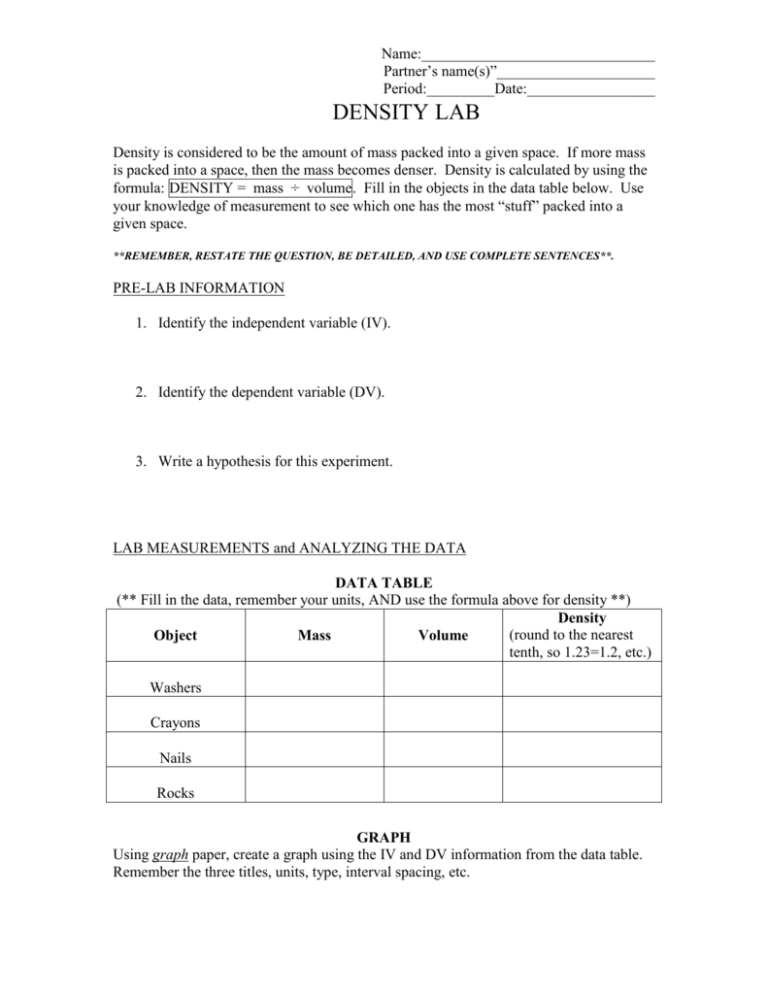
Name:_______________________________ Partner’s name(s)”_____________________ Period:_________Date:_________________ DENSITY LAB Density is considered to be the amount of mass packed into a given space. If more mass is packed into a space, then the mass becomes denser. Density is calculated by using the formula: DENSITY = mass ÷ volume. Fill in the objects in the data table below. Use your knowledge of measurement to see which one has the most “stuff” packed into a given space. **REMEMBER, RESTATE THE QUESTION, BE DETAILED, AND USE COMPLETE SENTENCES**. PRE-LAB INFORMATION 1. Identify the independent variable (IV). 2. Identify the dependent variable (DV). 3. Write a hypothesis for this experiment. LAB MEASUREMENTS and ANALYZING THE DATA DATA TABLE (** Fill in the data, remember your units, AND use the formula above for density **) Density (round to the nearest Object Mass Volume tenth, so 1.23=1.2, etc.) Washers Crayons Nails Rocks GRAPH Using graph paper, create a graph using the IV and DV information from the data table. Remember the three titles, units, type, interval spacing, etc. Name:_______________________________ Partner’s name(s)”_____________________ Period:_________Date:_________________ POST-LAB QUESTIONS --- (USE DATA!) **REMEMBER, RESTATE THE QUESTION, BE DETAILED, AND USE COMPLETE SENTENCES**. 1. Place the items of the experiment in order from least dense to most dense. 2. Identify three conditions that should be kept constant in this experiment. 3. Explain whether the results of the experiment support or do not support your hypothesis. Use specific data to justify your answer. 4. Describe 2 possible errors in the way the experiment was set up or performed. 5. Based upon the data, which of the objects is the closest to being able to float AND how do you know? Explain clearly and in detail.
