Supplemental Material_Park_Hong
advertisement

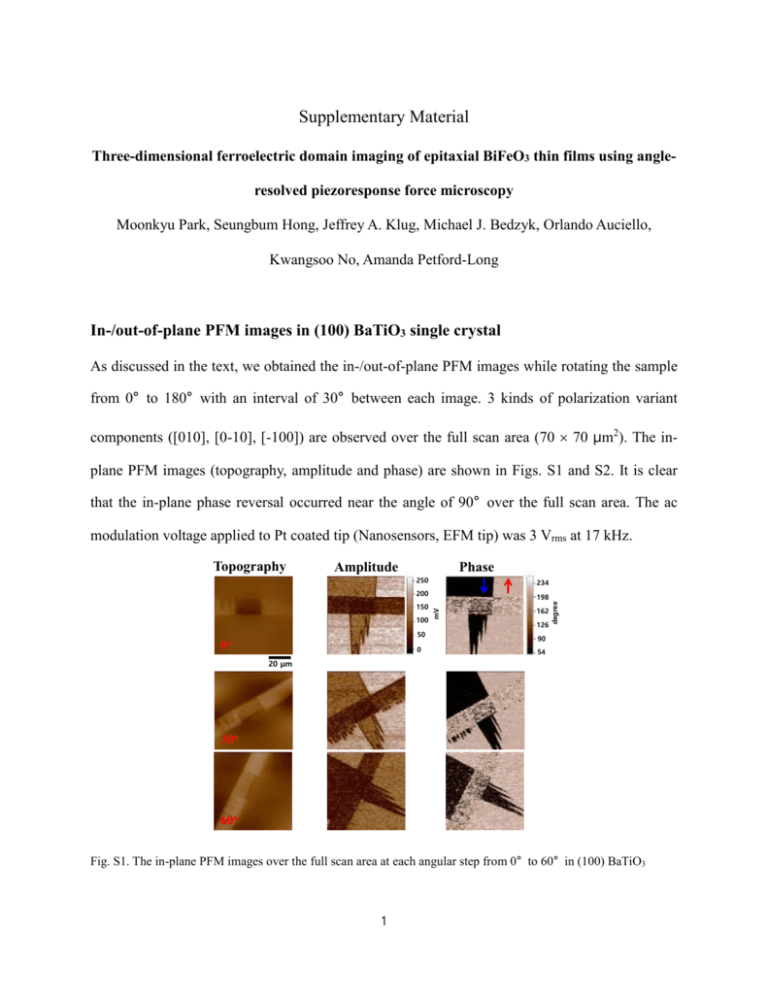
Supplementary Material Three-dimensional ferroelectric domain imaging of epitaxial BiFeO3 thin films using angleresolved piezoresponse force microscopy Moonkyu Park, Seungbum Hong, Jeffrey A. Klug, Michael J. Bedzyk, Orlando Auciello, Kwangsoo No, Amanda Petford-Long In-/out-of-plane PFM images in (100) BaTiO3 single crystal As discussed in the text, we obtained the in-/out-of-plane PFM images while rotating the sample from 0° to 180° with an interval of 30° between each image. 3 kinds of polarization variant components ([010], [0-10], [-100]) are observed over the full scan area (70 70 µm2). The inplane PFM images (topography, amplitude and phase) are shown in Figs. S1 and S2. It is clear that the in-plane phase reversal occurred near the angle of 90° over the full scan area. The ac modulation voltage applied to Pt coated tip (Nanosensors, EFM tip) was 3 Vrms at 17 kHz. Amplitude Phase 250 234 200 100 50 0o 0 198 mV 150 162 126 degree Topography 90 54 20 μm 30o 60o Fig. S1. The in-plane PFM images over the full scan area at each angular step from 0° to 60° in (100) BaTiO3 1 single crystal. Amplitude Phase 250 234 200 100 50 90o 0 198 mV 150 162 126 degree Topography 90 54 20 μm 120o 150o 180o Fig. S2. The in-plane PFM images over the full scan area at each angular step from 90° to 180° in (100) BaTiO3 single crystal. Fig. S3 shows the out-of-plane PFM images of the same area as that used for in-plane PFM images. The center region marked with polarization direction into the document, i.e. [00-1] direction showed a constant contrast while rotating the sample from 0° to 180° as expected. 2 Amplitude Phase 4 180 V 3 2 1 0o degree Topography 162 144 126 20 μm 30o 60o 90o 120o 150o 180o Fig. S3. The out-of-plane PFM images over the whole scan area of the each angular step from 0o to 180o in (100) BaTiO3 single crystal. 3 XRD analysis of BiFeO3 thin films As shown in Fig. S4, Phi scans of the BiFeO3 (BFO), SrRuO3 (SRO) and SrTiO3 (STO) (202) family of reflections confirm cube-on-cube epitaxy for both the thin film layers. Data were collected with horizontally and vertically focused Cu Ka1 radiation from an 18 kW rotating anode source (Rigaku) and a Huber four-circle diffractometer at the J. B. Cohen X-ray Diffraction Facility at Northwestern University. Fig. S4. Phi scans of the BFO, SRO, and STO Fig. S5 shows the out-of-plane XRD for the BFO, SRO, and STO. BFO and SRO films are both pseudocubic (001) oriented. The source of the peak labeled “?” is currently unknown, although it is present for all samples (BFO or otherwise). It is likely due to scattering from the sample holder or otherwise related to the instrument. 4 Fig. S5. Out-of-plane XRD plot for the BFO, SRO, and STO Out-of-plane PFM data of BiFeO3 thin films Fig. S6 shows the out-of-plane PFM phase data collected on BiFeO3 thin film of the each angular step from 0° to 180°. The scanned area was same as the area where we obtained in-plane PFM data in the text. The out-of-plane PFM phase images for all the angular steps showed bright contrast, which means the out-of-plane polarization pointed to downward direction. 5 162 0o degree 198 126 30o 500 nm 60o 90o 120o 150o y 180o z x Fig. S6. The out-of-plane PFM phase images of BiFeO3 film. Local distribution of in-plane polarization variants in the BiFeO3 thin films The areal fractions of the in-plane polarization variants in regions A and B of the Fig. 4h in manuscript are shown in Fig. S7. The numbers on the x-axis correspond to the polarization directions shown in the inset of Fig. S7B. 6 B A Region A 35 30 Areal fraction (%) Areal fraction (%) 35 25 20 15 10 30 12 1 11 2 10 3 9 4 25 5 8 20 6 7 15 10 5 5 0 Region B 0 1 2 3 4 5 6 7 8 9 10 11 12 1 2 3 4 5 6 7 8 9 10 11 12 In-plane polarization direction In-plane polarization direction Fig. S7. Areal fractions of in-plane polarization variants (A) in region A and (B) in region B. The projected amount of in-plane polarization variants along [010] direction is shown in Fig. S8 for both regions A and B, which was calculated by multiplying cosine value of angle between each variant and [010] direction with the areal fraction of each polarization variant. The sums of the projected amount are 37.9 and -43.9 in arbitrary units for regions A and B, respectively. B A 30 25 20 15 10 5 0 1 -5 -10 -15 -20 -25 -30 2 3 Region B 4 5 6 7 8 Projected amount along [010] direction (a.u) Projected amount along [010] direction (a.u.) Region A 9 10 11 12 30 25 20 15 10 5 0 1 -5 -10 -15 -20 -25 -30 11 12 1 2 3 10 9 4 5 8 7 2 3 4 5 6 7 8 6 9 10 11 12 Fig. S8. The projected amount of in-plane polarization variants to [010] direction (A) in region A and (B) in region B. 7 Similarly, the projected amount of in-plane polarization variants along [100] direction is shown in Fig. S9 for both regions A and B. The sums of the projected amount are -13.4 and 23.5 in arbitrary units for regions A and B, respectively. B A 30 25 20 15 10 5 0 1 -5 -10 -15 -20 -25 -30 2 3 4 5 6 7 8 Projected amount along [100] direction (a.u.) Projected amount along [100] direction (a.u.) Region A 9 10 11 12 Region B 30 25 20 15 10 5 0 1 -5 -10 -15 -20 -25 -30 11 12 1 3 9 4 5 8 7 2 3 4 5 6 7 8 2 10 6 9 10 11 12 Fig. S9. The projected amount of in-plane polarization variants to [100] direction (A) in region A and (B) in region B. 8 The areal fractions of the in-plane polarization variants of submicron area (whole region in Fig. 4h in the text) are shown in Fig. S10. The numbers on the x-axis correspond to the polarization directions shown in the inset of Fig. S10. 25 11 12 1 2 3 Areal fraction (%) 10 20 9 4 5 8 7 6 15 10 5 0 1 2 3 4 5 6 7 8 9 10 11 12 In-polariztion vatraints Fig. S10. Areal fractions of the in-plane polarization variants of the submicron area. The projected amount of in-plane polarization variants along [010] direction is shown in Fig. S11A for the submicron area (whole region in Fig. 4h in the text), which was calculated by multiplying cosine value of angle between each variant and [010] direction with the areal fraction of each polarization variant. The sum of the projected amount is -16 in arbitrary unit. Similarly, the projected amount of in-plane polarization variants along [100] direction is shown in Fig. S11B. The sum of the projected amount is 14 in arbitrary unit. B Projected amount along [100] direction (a.u.) Projected amount along [010] direction (a.u.) A 40 30 20 10 0 1 2 3 4 5 6 7 8 9 10 11 12 -10 -20 -30 -40 9 40 30 11 12 1 2 3 10 20 9 4 5 8 7 10 0 -10 -20 -30 -40 1 2 3 4 5 6 7 8 6 9 10 11 12 Fig. S11. The projected amount of the in-plane polarization variants to (A) [010] and (B) [100] directions of the submicron area. 10


