Supplementary Methods (doc 76K)
advertisement
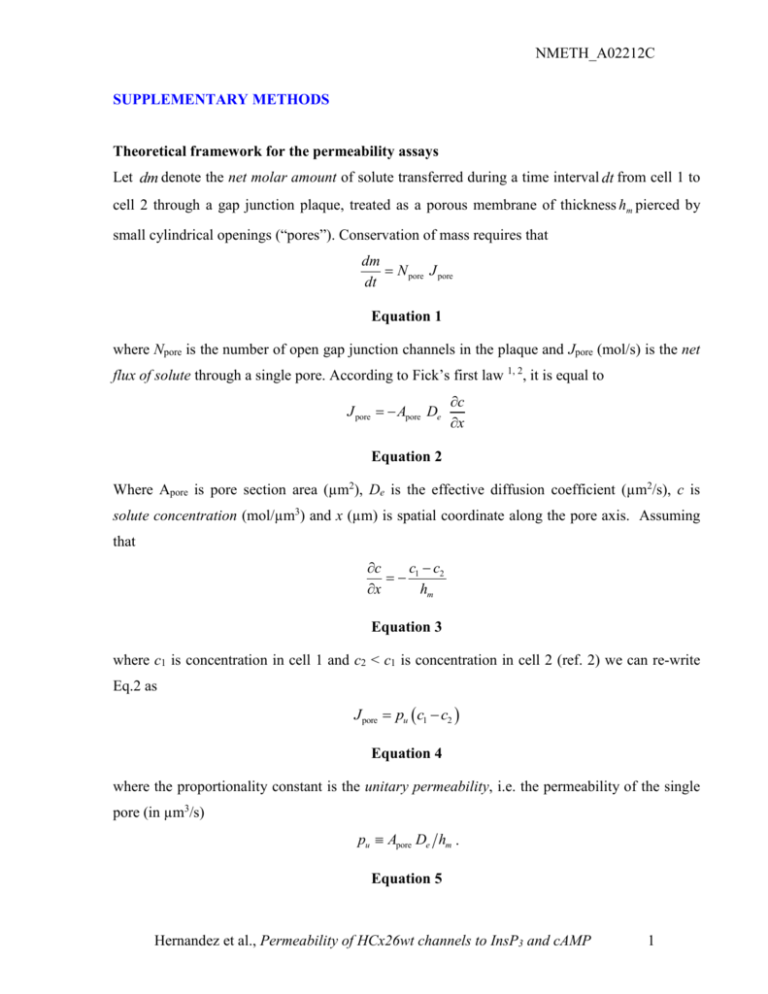
NMETH_A02212C SUPPLEMENTARY METHODS Theoretical framework for the permeability assays Let dm denote the net molar amount of solute transferred during a time interval dt from cell 1 to cell 2 through a gap junction plaque, treated as a porous membrane of thickness hm pierced by small cylindrical openings (“pores”). Conservation of mass requires that dm N pore J pore dt Equation 1 where Npore is the number of open gap junction channels in the plaque and Jpore (mol/s) is the net flux of solute through a single pore. According to Fick’s first law 1, 2, it is equal to J pore Apore De c x Equation 2 Where Apore is pore section area (µm2), De is the effective diffusion coefficient (µm2/s), c is solute concentration (mol/µm3) and x (µm) is spatial coordinate along the pore axis. Assuming that c c c 1 2 x hm Equation 3 where c1 is concentration in cell 1 and c2 < c1 is concentration in cell 2 (ref. 2) we can re-write Eq.2 as J pore pu c1 c2 Equation 4 where the proportionality constant is the unitary permeability, i.e. the permeability of the single pore (in µm3/s) pu Apore De hm . Equation 5 Hernandez et al., Permeability of HCx26wt channels to InsP3 and cAMP 1 NMETH_A02212C This is the critical parameter we sought to derive from the experiments by monitoring optically the time course of the fluorescence changes in the injected cell (cell 1) and recipient cell (cell 2). Due to influx through the gap junction channels, the concentration in cell 2 increases at a rate dc2 1 dm dt V2 dt Equation 6 where V2 is the volume of cell 2. By combining the above equations and solving for pu we obtain pu V2 dc2 dt . N pore c1 c2 Equation 7 Thus the estimate of pu based on Equation 7 requires the measurement of Npore, V2, c1 and c2. The methods used to perform these measurements are described hereafter. Fluorescence imaging To monitor optically the transfer of the injected compound from cell 1 to cell 2 we used fluorescence imaging in combination with patch clamp recordings. Image acquisition on the BX51 microscope was performed using software developed in the laboratory 3. For LY, illumination was set at a wavelength of 425 nm by a fast switching monochromator (Polychrome IV, TILL Photonics, Martinsried, Germany) and directed onto the sample through a dichromatic mirror (440dclp, Chroma, Rockingham, VT, USA). Fluorescence emission was selected around 540 nm using a D540/40m filter (Chroma) to form fluorescence images on a scientific grade CCD camera (SensiCam, PCO Computer Optics GmbH, Kelheim, Germany). Image sequences were stored on disk and processed off-line using the Matlab 7.0 software package (The MathWorks, Inc., Natick, MA, USA), as described below. To quantify the error due to LY binding to cytosolic andor nuclear elements, we performed control experiments taking advantage of the intrinsic optical sectioning capabilities of our two-photon microscope (Radiance 2100, Biorad/Carl Zeiss MicroImaging GmbH, Gottingen, Germany) powered by a Tsunami pulsed laser (Spectra Physics/Newport Corporation, Irvine, CA, USA). HeLa cells were loaded through patch pipettes containing 440 µM LY in the presence of an equal concentration of the dye in the bathing solution. After equilibration of the Hernandez et al., Permeability of HCx26wt channels to InsP3 and cAMP 2 NMETH_A02212C intracellular concentration (approximately 10 min), LY fluorescence emission, excited at 835 nm in a thin optical slice (thickness < 1 µm), was compared to fluorescence from the surrounding medium in the same focal plane. For InsP3 or cAMP, Fluorescence Resonance Energy Transfer (FRET) images 4 were acquired by interposing a custom-made image-forming beamsplitter between the microscope output optical port and the CCD camera. The beamsplitter was equipped with a dichromatic mirror (515dcrx, Chroma) and emission filters (d480/40 and hq535/30, Chroma) for CFP-YFP emission separation, following CFP excitation at 430 nm. Sequences of image pairs were acquired synchronously at the two emission wavelengths and stored on disk for off-line processing. In all fluorescence experiments, the effects of photobleaching were rendered virtually negligible by carefully selecting the most appropriate inter-frame interval while controlling illumination with a mechanical shutter triggered by the FVAL signal. Measurement of cell volumes Immediately after the end of each intracellular delivery experiment, a through-focus sequence of fluorescence images of the patch-clamped cell pair was acquired by stepping the objective along the optical (z) axis of the microscope with a resolution z of 250 nm or 300 nm. We obtained digital confocal sections by multi-neighbour deconvolution using a direct estimate of the microscope point-spread function (PSF), as described in ref.3. Cell section area Aj in the j-th deconvolved image was measured by identifying boundaries with the Canny edge detection algorithm 5 (Fig. 1b). Finally, we computed cell volume as V z Aj (Fig. 1c). In the population sampled in this study, cell base area A1 = 500176 m2 and volume V = 2190594 m3 (mean standard deviation, n=17 in both cases) were not correlated (Fig. 1d). Estimate of permeant molecule concentration For LY, c1,2 were estimated from the single-wavelength background-subtracted fluorescence emission intensities (F). For each pixel of the 12-bit CCD camera used in this study, F is an integer number comprised between 0 and 4095 (gray levels). Since F signals collected through a Hernandez et al., Permeability of HCx26wt channels to InsP3 and cAMP 3 NMETH_A02212C wide field fluorescence microscope, and integrated over cell volume, are proportional to the number of fluorescent molecules in each cell 6, pixel gray values were summed within ROIs drawn on the fluorescence images along the contours of each cell at its base. Division by cell volume then yielded an estimate of LY concentration in units of gray levels / m3 (see Results and Fig.2a). For cAMP (or InsP3) FRET images at the two emission wavelengths were divided pixel-bypixel to generate an emission ratio at each sampled point. A well known advantage of dualwavelength over single-wavelength imaging is that the rationing operation cancels out most or all of the possible variability due to the instrument efficiency and content of the fluorescent molecular sensor 7. Thus the ratio of the fluorescence emission images yields a non-linear function of the cAMP (or InsP3) concentration within the cell. Average ratio values for the FRET signals were obtained by encompassing the image of each cell within a ROI drawn along the contours of the cell base, and averaging pixel ratios within each ROI. To calibrate these spatially averaged ratio signals, R, known amounts of cAMP (or InsP3) were delivered to single transfected HeLa cells through patch pipettes filled with the same solutions used for the permeability assays. Dose-response curves (Fig. 3a and Fig. 4a) are shown as ratio changes, R R Ro , vs. pipette concentration. Here Ro is pre-stimulus ratio, measured prior to achieving the wholecell configuration (1.11±0.01, n = 6 LIBRA transfectants; 0.81±0.05, n = 6 H30 transfectants). The steady-state R values used for the dose-response curves were obtained by maintaining the whole-cell configuration for a time long enough to permit equilibration with the pipette content by passive diffusion. This time varied between few minutes (at saturating concentrations) to more than 10 minutes (at the lowest concentrations). Throughout this process, cell viability was monitored electrophysiologically by verifying that access resistance, membrane resistance, cell capacitance and zero-current potential stayed within 10% of their initial values. Only cells meeting these multiple criteria were retained for the analysis. Dose-response data at each concentration are averages of n 5 cells. Estimate of transfer rate and unitary permeability Knowledge of the dose-response curves permits to estimate the unitary permeability pu by converting FRET ratios R1,2 to the corresponding concentrations c1,2 of Equation 7. Hernandez et al., Permeability of HCx26wt channels to InsP3 and cAMP 4 NMETH_A02212C Mathematically, this is equivalent to inverting the dose-response function, but in practice this operation is subjected to controllable errors only in a limited range near the inflection point, where approximate proportionality between c and R occurs. Thus unitary permeability was computed as pu V2k j g j where kj indicates the junctional transfer rate that was estimated as kj dR2 / dt . R1 R2 Since pu is a constant, internal consistency implies that the only data which ought to be retained for the analysis are those acquired during a sub-interval (t1, t2) of the recording period in which the time derivative of V2 k j g j approaches zero (starred points in Fig. 3d and Fig. 4d). References 1. 2. 3. 4. 5. 6. 7. Fick, A. Ueber diffusion. Poggendorff’s Annalen der Physik und Chemie 94, 59-86 (1855). Benedek, G., Villars, FMH in Biological Physics Series, Vol. 2, STATISTICAL PHYSICS, Edn. Second edition. (ed. E. Greenbaum) 91-261 (Springer-Verlag New York, Inc., New York; 2002). Bastianello, S., Ciubotaru, C.D., Beltramello, M. & Mammano, F. in Three-Dimensional and Multidimensional Microscopy: Image Acquisition and Processing XI, Vol. 5324, 265-274, San Jose, California; 2004). Periasamy, A. & Day, R.N. in Green Fluorescent Proteins, Vol. 58. (ed. K.F. Sullivan) (Academic Press, San Diego; 1999). Canny, J. A computational approach to edge detection. IEEE Trans. Pattern Analysis and Machine Intelligence 8, 679-714 (1986). Eckert, R. Gap-junctional single-channel permeability for fluorescent tracers in mammalian cell cultures. Biophys J 91, 565-579 (2006). Grynkiewicz, G., Poenie, M. & Tsien, R.Y. A new generation of Ca2+ indicators with greatly improved fluorescence properties. J Biol Chem 260, 3440-3450 (1985). Hernandez et al., Permeability of HCx26wt channels to InsP3 and cAMP 5
