Yossifon_Chang_supplementary_material
advertisement
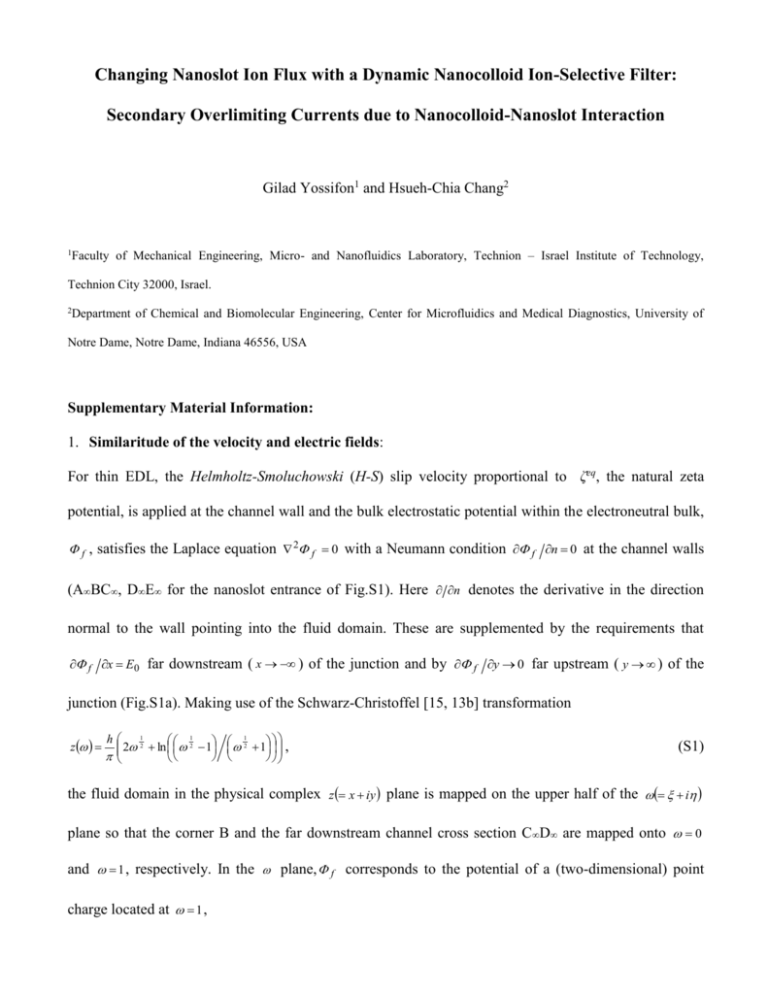
Changing Nanoslot Ion Flux with a Dynamic Nanocolloid Ion-Selective Filter: Secondary Overlimiting Currents due to Nanocolloid-Nanoslot Interaction Gilad Yossifon1 and Hsueh-Chia Chang2 1 Faculty of Mechanical Engineering, Micro- and Nanofluidics Laboratory, Technion – Israel Institute of Technology, Technion City 32000, Israel. 2 Department of Chemical and Biomolecular Engineering, Center for Microfluidics and Medical Diagnostics, University of Notre Dame, Notre Dame, Indiana 46556, USA Supplementary Material Information: 1. Similaritude of the velocity and electric fields: For thin EDL, the Helmholtz-Smoluchowski (H-S) slip velocity proportional to ζeq, the natural zeta potential, is applied at the channel wall and the bulk electrostatic potential within the electroneutral bulk, f , satisfies the Laplace equation 2 f 0 with a Neumann condition f n 0 at the channel walls (ABC, DE for the nanoslot entrance of Fig.S1). Here n denotes the derivative in the direction normal to the wall pointing into the fluid domain. These are supplemented by the requirements that f x E0 far downstream ( x ) of the junction and by f y 0 far upstream ( y ) of the junction (Fig.S1a). Making use of the Schwarz-Christoffel [15, 13b] transformation z 1 h 12 1 2 ln 2 1 2 1 , (S1) the fluid domain in the physical complex z x iy plane is mapped on the upper half of the i plane so that the corner B and the far downstream channel cross section CD are mapped onto 0 and 1 , respectively. In the plane, f corresponds to the potential of a (two-dimensional) point charge located at 1 , f E0 h ln 12 2 2 , (S2) and a stream function . tan 1 1 E0 h (S3) y (a) (b) A Nano-slot C Micro-chamber B(0,h) E0 h (0,0) D E x Fig.S1:(a) The micro-nano-channel junction configuration; (b) The streamline pattern in the vicinity of the junction (channel dimensions are normalized by h). Since for the case of a thin EDL the slip velocity equals the tangential electric field multiplied by the constant factor according to the H-S relation, the velocity field everywhere can be represented by v eq 0 f f , which has zero curl. Herein, f is the dielectric constant of the fluid and is the fluid viscosity. We thus obtain the well-known similaritude of the irrotational velocity and electric fields without vortices [14]. Hence, the stream function (S3) of the electric field also represents that of the velocity field and is plotted in Fig.S1b. 2. Fig.S2: Calculated (eqs. (1), (2)) x-component velocity (normalized by eq 0 f E0 ) profile within the nanoslot (y is normalized by h) for varying Debye lengths. 1 h 0.75 0.01 y 0.1 0.5 0.25 0.5 1 0.25 0 0 0.25 0.5 0.75 1 u 3. Numerical simulations: The finite-element based numerical simulation (COMSOL software) solves the coupled Poisson, continuity of ions (Nernst-Planck) and modified Stokes equations. The boundary conditions for the Poisson equation are constant surface charge on the walls (AFED, BC) and applied voltage difference on CD, AB. For the ionic continuity equation (Nernst-Planck) these are the impenetrability conditions on the walls and constant bulk concentration on AB, CD. For the modified Stokes equation these are the noslip boundary condition on the walls and zero pressure gradient on AB, CD. D A Microchamber Microchamber E F C B Nanoslot Fig.S3: Schematics of the nanoslot bounded by two microreservoirs model geometry. 4. “Movie 1” - Complementary video to the stills frames of Fig.2 - showing the colloid dynamics for different applied voltages in the case of weak electrolyte (0.1mM) and 1.2μm beads without fluorescent dye molecules in the background electrolyte solution. 5. “Movie 2” - Complementary video to the stills frames of Fig.3 – showing the colloid dynamics for different applied voltages in the case of strong electrolyte (0.1M), 1.2μm beads and fluorescent dye molecules (Rhodamine 6G 10μM) in the background electrolyte solution. 6. “Movie 3” - Complementary video to the stills frames of Fig.5 – showing the transient depletion/enrichment regions buildup and associated colloid dynamics for a stepwise applied 30V in the case of weak electrolyte (0.1mM), 1.2μm beads and fluorescent dye molecules (Rhodamine 6G 10μM). 7. “Movie 4” – video showing the colloid dynamics for different applied voltages in the case of weak electrolyte (0.1mM) and smaller bead size (250nm) without fluorescent dye molecules in the background electrolyte solution.
