Chapter 3 Statistical methods in hydrology
advertisement
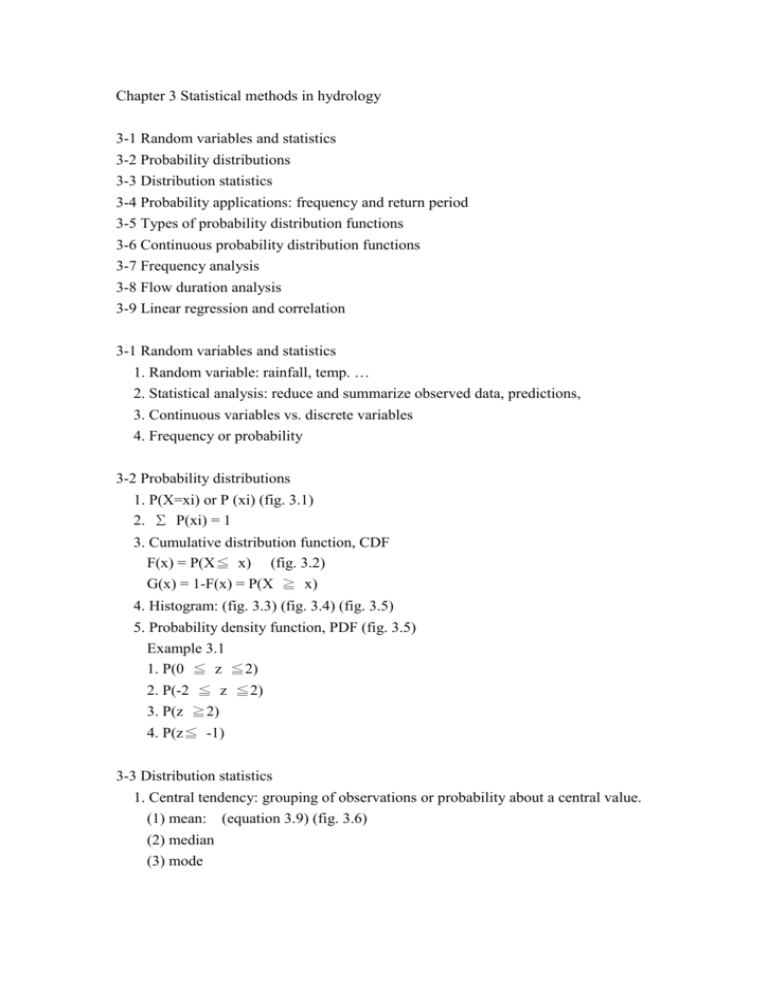
Chapter 3 Statistical methods in hydrology 3-1 Random variables and statistics 3-2 Probability distributions 3-3 Distribution statistics 3-4 Probability applications: frequency and return period 3-5 Types of probability distribution functions 3-6 Continuous probability distribution functions 3-7 Frequency analysis 3-8 Flow duration analysis 3-9 Linear regression and correlation 3-1 Random variables and statistics 1. Random variable: rainfall, temp. … 2. Statistical analysis: reduce and summarize observed data, predictions, 3. Continuous variables vs. discrete variables 4. Frequency or probability 3-2 Probability distributions 1. P(X=xi) or P (xi) (fig. 3.1) 2. Σ P(xi) = 1 3. Cumulative distribution function, CDF F(x) = P(X≦ x) (fig. 3.2) G(x) = 1-F(x) = P(X ≧ x) 4. Histogram: (fig. 3.3) (fig. 3.4) (fig. 3.5) 5. Probability density function, PDF (fig. 3.5) Example 3.1 1. P(0 ≦ z ≦2) 2. P(-2 ≦ z ≦2) 3. P(z ≧2) 4. P(z≦ -1) 3-3 Distribution statistics 1. Central tendency: grouping of observations or probability about a central value. (1) mean: (equation 3.9) (fig. 3.6) (2) median (3) mode 2. Variability: dispersion of the variate or observations. (1) variance (eq. 3.11) (2) standard deviation (3) coefficient of variation 3. Skewness: degree of asymmetry of the distribution. (1) third moment (eq. 3.13) (2) coefficient of skewness (eq. 3.14) a. right skewness (positive) b. left skewness (negative) Example 3.2 3-4 Probability applications: frequency and return period 1. Frequency: n1 2. Relative frequency: n1/N 3. Return period: T (eq. 3.21) 4. Risk: R (eq. 3.25) Example 3.4 3-5 Types of probability distribution functions 1. Types: Table 3.3 2. PDF, mean, variance 3-6 Continuous probability distribution functions 1. Normal distribution: symmetrical, bell-shaped frequency function Example 3.5 2. Lognormal distribution: y = ln x 3. Gama (and Pearson Type Ⅲ ) distribution: 4. Gumbel’s extremal distribution: 3-7 Frequency analysis 1. Plotting formulas: Table 3.4 Example 3.6 2. Annual and partial-duration series (1) complete series: all data (2) partial series: subset of complete series (3) partial-duration series: extreme values 3. Plotting paper: 4. Frequency analysis by frequency factors: (1) normal: eq. 3.40 Example 3.7 (2) lognormal: eq. 3.41 (3) log-Pearson Ⅲ: eq. 3.42 & 3.43 Example 3.8 (4) Gumbel’s extreme value: Example 3.9 & 3.10 5. Steps in frequency analysis (p: 65) (1) data homogeneity? (2) rank data, calculate P (3) calculate and plot PDF and CDF (4) assess and recomputed (5) compare and adjust 6. Effect of record length on flood prediction 7. Frequency curve confidence limits Example 3.11 3-8 Flow duration analysis 1. Duration curve: fig. 3.11 – fig. 3.14 2. Considering time factor 3-9 Linear regression and correlation 1. Linear correlation coefficient 2. Standard error 3. Regression equations Example 3.12 4. Coefficient of determination for the regression Example 3.13 5. Multiple linear regressions Y = a + b1X1 + b2X2 6. Nonlinear bivariate and multivariate Y = aX1b1X2b2 7. Linear transformations logY = loga + b1logX1 + b2logX2


