Describing Risk
advertisement
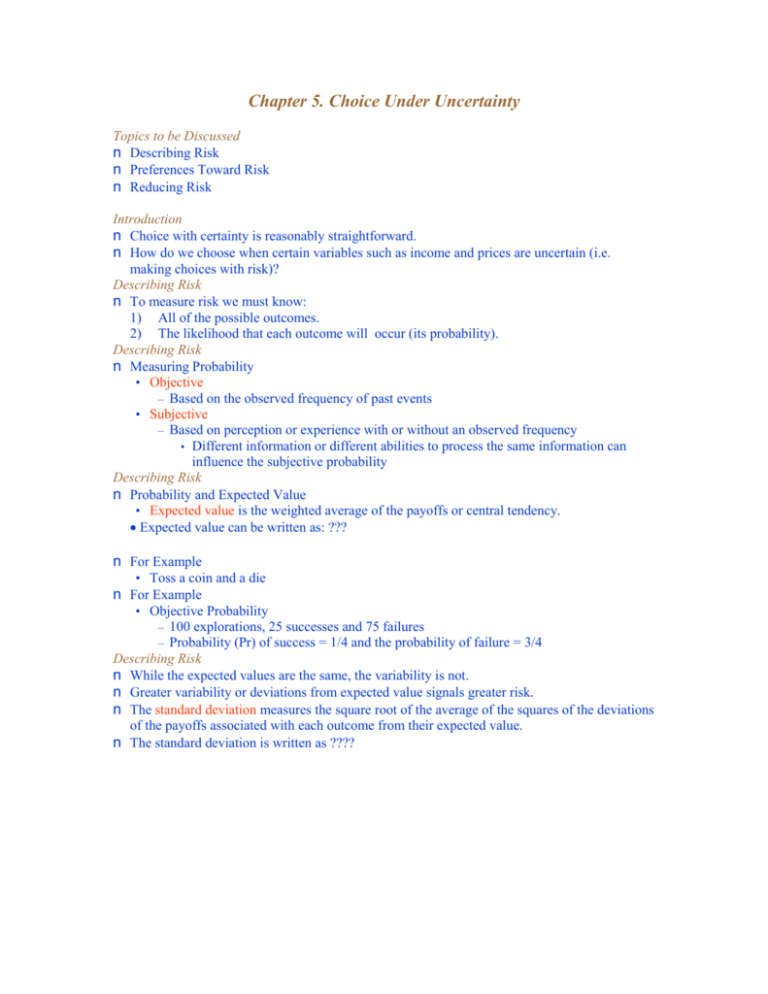
Chapter 5. Choice Under Uncertainty Topics to be Discussed n Describing Risk n Preferences Toward Risk n Reducing Risk Introduction n Choice with certainty is reasonably straightforward. n How do we choose when certain variables such as income and prices are uncertain (i.e. making choices with risk)? Describing Risk n To measure risk we must know: 1) All of the possible outcomes. 2) The likelihood that each outcome will occur (its probability). Describing Risk n Measuring Probability • Objective – Based on the observed frequency of past events • Subjective – Based on perception or experience with or without an observed frequency • Different information or different abilities to process the same information can influence the subjective probability Describing Risk n Probability and Expected Value • Expected value is the weighted average of the payoffs or central tendency. Expected value can be written as: ??? n For Example • Toss a coin and a die n For Example • Objective Probability – 100 explorations, 25 successes and 75 failures – Probability (Pr) of success = 1/4 and the probability of failure = 3/4 Describing Risk n While the expected values are the same, the variability is not. n Greater variability or deviations from expected value signals greater risk. n The standard deviation measures the square root of the average of the squares of the deviations of the payoffs associated with each outcome from their expected value. n The standard deviation is written as ???? n Choosing Among Risky Alternatives • Assume – Consumption of a single commodity – Consumer’s know all probabilities – Payoffs measured in terms of utility – Utility function given Preferences Toward Risk n Example • A person is earning $45,000 and receiving 212 units of utility from the job. • She is considering a new, but risky job. • She has a .50 chance of increasing her income to $90,000 and a .50 chance of decreasing her income to $10,000. • She will evaluate the position by calculating the expected value (utility) of the resulting income • Her utility is expressed as U=SQRT(W) n Example • The expected utility of the new position is the sum of the utilities associated with all her possible incomes weighted by the probability that each income will occur. Preferences Toward Risk n The expected utility can be written: • E(u) = • What would be her decision ? New job or current job? Preferences Toward Risk n Different Preferences Toward Risk • People can be • risk averse, • risk loving • risk neutral. • A person who prefers a certain given income to a risky job with the same expected income is risk averse. RISK AVERSE n Different Preferences Toward Risk • A person is considered risk averse if they have a diminishing marginal utility of income – The use of insurance demonstrates risk aversive behavior. n Scenario • A person can have a $20,000 job with 100% probability and receive a utility level of 16. • The person could have a job with a .5 chance of earning $30,000 and a .5 chance of earning $10,000. n Scenario • Her expected income of the new position would be: ???? RISK NEUTRAL n Scenario • A person is said to be risk neutral if they show no preference between a certain income, and an uncertain one with the same expected value. RISK LOVING n Scenario • A person is said to be risk loving if they show a preference toward an uncertain income over a certain income with the same expected value. – Examples: Gambling, some criminal activity Preferences Toward Risk n The risk premium is the amount of money that a risk-averse person would pay to avoid taking a risk. n How much would the person pay to avoid risk? Preferences Toward Risk n Variability in potential payoffs increase the risk premium. Reducing Risk n Three ways consumers attempt to reduce risk are: 1) Diversification 2) Insurance Diversification n Diversification • Suppose a firm has a choice of selling air conditioners, heaters, or both. • The probability of it being hot or cold is .50. • The firm would probably be better off by diversification. n If the firms sells only heaters or air conditioners their income will be either $12,000 or $30,000. n Their expected income would be: • 1/2($12,000) + 1/2($30,000) = $21,000 n If the firm divides their time evenly between appliances their air conditioning and heating sales would be half their original values. n If it were hot, their expected income would be $15,000 from air conditioners and $6,000 from heaters, or $21,000. n If it were cold, their expected income would be $6,000 from air conditioners and $15,000 from heaters, or $21,000. Insurance n Insurance • Risk averse people will purchase enough to recover any financial loss they might suffer. Reducing Risk n The law of large numbers tells us that while individual events are random and unpredictable, the average outcome of many similar events can be predicted. n Examples – A single coin toss vs. large number of coins – Whom will have a car wreck vs. the number of wrecks for a large group of drivers Summary n Consumers and managers frequently make decisions in which there is uncertainty about the future. n Consumers and investors are concerned about the expected value and the variability of uncertain outcomes. n Facing uncertain choices, consumers maximize their expected utility, and average of the utility associated with each outcome, with the associated probabilities serving as weights. n A person may be risk averse, risk neutral or risk loving. n The maximum amount of money that a risk-averse person would pay to avoid risk is the risk premium. n Risk can be reduced by diversification, purchasing insurance, and obtaining additional information. n The law of large numbers enables insurance companies to provide actuarially fair insurance for which the premium paid equals the expected value of the loss being insured against.
