DOC - Europa
advertisement
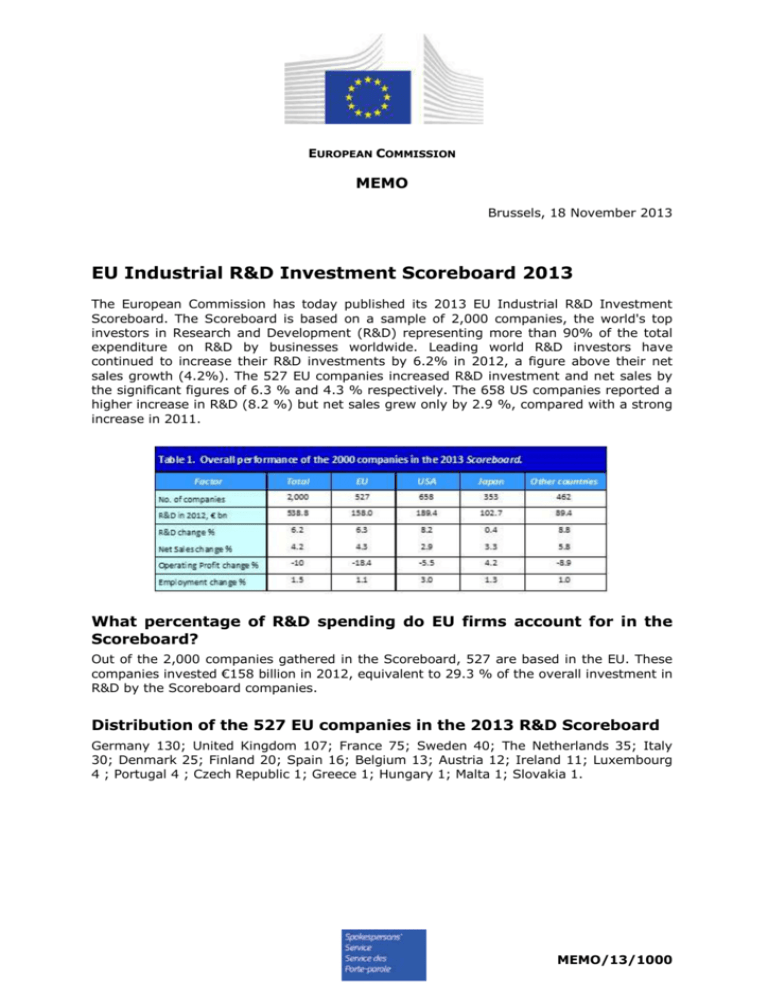
EUROPEAN COMMISSION MEMO Brussels, 18 November 2013 EU Industrial R&D Investment Scoreboard 2013 The European Commission has today published its 2013 EU Industrial R&D Investment Scoreboard. The Scoreboard is based on a sample of 2,000 companies, the world's top investors in Research and Development (R&D) representing more than 90% of the total expenditure on R&D by businesses worldwide. Leading world R&D investors have continued to increase their R&D investments by 6.2% in 2012, a figure above their net sales growth (4.2%). The 527 EU companies increased R&D investment and net sales by the significant figures of 6.3 % and 4.3 % respectively. The 658 US companies reported a higher increase in R&D (8.2 %) but net sales grew only by 2.9 %, compared with a strong increase in 2011. What percentage of R&D spending do EU firms account for in the Scoreboard? Out of the 2,000 companies gathered in the Scoreboard, 527 are based in the EU. These companies invested €158 billion in 2012, equivalent to 29.3 % of the overall investment in R&D by the Scoreboard companies. Distribution of the 527 EU companies in the 2013 R&D Scoreboard Germany 130; United Kingdom 107; France 75; Sweden 40; The Netherlands 35; Italy 30; Denmark 25; Finland 20; Spain 16; Belgium 13; Austria 12; Ireland 11; Luxembourg 4 ; Portugal 4 ; Czech Republic 1; Greece 1; Hungary 1; Malta 1; Slovakia 1. MEMO/13/1000 What are the EU's top 10 R&D investing companies? Expanded EU analysis Top 1,000 companies: trends in the 10 Top Member States by R&D investment of Scoreboard companies Companies based in the 10 top R&D investing Member States account for 97.3 % of the total R&D of the Top 1000 EU companies1 (these all have R&D investments exceeding €5.2 million). Those based in Germany, the top R&D investor, continued the good performance shown in the past year, increasing R&D in 2012 well above the top 2000 world R&D investors' average, at 11.6 %. On the contrary, companies based in the UK and France showed a poor performance, increasing R&D by 0.5 % and 2.3 % respectively. Among the group of 10 largest EU countries (by R&D investment of Scoreboard companies based in that country), those whose companies increased R&D above the EU's average were Italy (18.3 %), Ireland (10.7 %), the Netherlands (7.7 %) and Sweden (6.7 %). Companies based in three countries decreased R&D in 2012: Finland (-10.3 %), Denmark (-3.0 %) and Spain (-2.1 %). 1 The top 1,000 R&D investors in the EU is an extended sample of companies representing, the 527 EU companies included in the world top 2,000 sample and 473 additional companies based in the EU. 2 In many countries, the aggregate country indicators depend to a large extent on the figures of a very few firms. For example, the R&D growth of Fiat (51.5%), accounting for more than 36 % of the R&D of companies based in Italy, contributed a significant part of the R&D growth of that country. Three companies from the Automobiles & Parts sector, accounting for 32% of the R&D of companies based in Germany, contributed a large part of the that country's R&D growth: Volkswagen (32.1 %), Robert Bosch (16.1 %) and BMW (17.2 %). It is important to note that the growth of companies is often accompanied by mergers and acquisitions. Relevant cases of M&A involving Scoreboard companies in 2012 are referred to in the SB report and include for example the acquisition of Porsche by Wolkswagen (from 49.9% to 100%) and of Motorola Mobility by Google (acquisition of 100%). Which companies and sectors invest the most, and who are the overall best performers? For the first time since 2004, a company based in the EU leads the world R&D ranking: the German carmaker Volkswagen with €9.5bn invested in R&D. Samsung Electronics from South Korea jumps to the second place. The other companies in the top ten are five from the US (three pharma --Merck US, Johnson & Johnson and Pfizer, and two ICT --Microsoft, Intel), two from Switzerland (both pharma --Roche and Novartis) and one from Japan (automobile, Toyota). The largest R&D increases in the 100 top companies continue to be, as in 2011, in the Automobiles & Parts and in the ICT sectors: e.g., Tata Motors, India (77.6%); Fiat, Italy (51.5%); 3M, US (57.7%); Western Digital, US (49.0%); Apple, US (39.2%); Volkswagen, Germany (32.1%); QUALCOMM, US (30.7%), HUAWEI, China (30.3%), GOOGLE, US (27.7%). 3 Among the top 100 group, 14 companies have simultaneously increased R&D and net sales by more than 200% since 2004 while showing positive operating profits in the last reporting period. Nine of these companies are based in the US, two in China and one each in Taiwan, India, Brazil and Canada. The first five are ICT companies based in the US: Google (Internet), Oracle (Software), Qualcomm (Telecom Equipment), Apple (Computer Hardware) and Broadcom (Semiconductors). What is the performance of EU companies compared to US? Scoreboard companies in the Software and Computer Services sector based in the EU show very strong increases: 14.2% in R&D growth, coupled with 9.7% growth in sales (against 12.6% and 6.9% respectively for the US). This contrasts with negative figures in the Technology Hardware & Equipment sector for EU companies (-2.3% in R&D and -9.3% in sales) while very positive developments (14.8% and 6.8% respectively) are observed for US ones. In the Automobiles & Parts, Industrial Engineering and Aerospace & Defence sectors, EU based companies' growth clearly outperforms that of their US counterparts. For the Automobiles & Parts sector, EU companies show very high increases in R&D investment and sales (14.2% and 11.3% respectively) vs US based automobiles & parts companies (2.6% for R&D and 0% for sales growth). In the case of the Aerospace & Defence sector, strong regional differences are also observed in favour of the EU: increases of 9.5% in R&D and 8.3% in sales (against -1.3% and 6.7% respectively in the US). 4 In 2012, the Scoreboard companies of the pharmaceutical and biotech sector based in the US slowed-down, (4.3% in R&D but -0.3% in sales, compared with 3.2% and 2.8% respectively in the EU). However, the trend over the last ten years shows that the EU-US R&D investment gap in this sector is maintained. A detailed analysis of the therapeutic biotechnology subsector shows the dominance of the US: nine of the top ten companies are based in this country. Evidence also shows that there are a number of examples of EU companies which show both high performance and the ability to grow to a sustainable size through well-chosen collaborations, mainly with the large pharmaceutical counterparts. The above described divergent sectoral performances observed in 2012 point to a reinforcement of their relative specialisation: towards medium-high R&D intensive sectors in the EU and towards high R&D intensive sectors in the US ones. Where do EU-based companies perform their research? In the context of the Scoreboard, companies are allocated to the country of their registered office, which might differ from the place where R&D activities are undertaken. “EU companies” are those whose ultimate parent is registered in an EU Member State. Evidence compiled in the EU and by the OECD show that multinational groups tend to invest around 80% in the region where they are registered, therefore Scoreboard figures correlated fairly closely with the overall private sector R&D investment trends in each region of the world (not necessarily the same case for countries). What kind of data does the Scoreboard present? The Scoreboard collects companies’ key R&D and economic indicators namely R&D investment, net sales, capital expenditures, operating profits and number of employees. Data correspond to the companies’ latest published accounts. For most companies these correspond to calendar year 2012, but a significant proportion have financial years ending on 31 March 2013. The R&D investment included in the Scoreboard is the cash investment that is funded by the companies themselves. It excludes R&D funded by contracts with third parties such as governments or other firms. Companies' behaviour and performance can be analysed over longer time periods using our history database that contains information on the top R&D companies since 2003. This enables benchmarking analyses of companies across sectors and countries, for example to identify companies showing outstanding economic or innovation results and to analyse the main factors underlying such successful dynamics. The Scoreboard is part of the European Commission’s monitoring activities to improve the understanding of trends in R&D investment, created in response to the Commission’s Research Investment Action Plan. Is the crisis over? Trends over the past 10 years show that companies based in the EU and the US have recovered levels of R&D investment prior to the crisis whereas that of net sales, that recovered significantly in 2010-2011, fell well below the rate of R&D growth in 2012. 5 What can be companies? observed about employment in Scoreboard The companies listed in this year's Scoreboard employed 48.471 million people in 2012, 1.5% more than the previous year. In the period 2004-2012, the overall worldwide employment of Scoreboard companies2 increased by 27.9% led by increases in high R&D-intensive sectors (42.0%) and mediumhigh ones (29.9%). For the EU companies, the overall employment growth was 22.6%, increasing by 49.2% in high R&D-intensive sectors and by 24.2% in medium-high sectors. Is Europe an attractive place for R&D investments from third countries? The EU, together with US, plays a major role in the international investment scenario, both as source and destination of the knowledge intensive foreign direct investments (FDIs). From 2003-2012, the EU attracted 22% of FDI projects on R&D from the set of non-EU companies while US receive only a share of 8 % (source: FT fDi Markets database). Six out of the 10 countries with the highest number of international projects are European. EU proportionally attracts more knowledge-intensive than manufacturing investments (29% inflow of FDIs in R&D versus 26% inflow of manufacturing FDIs). Most of FDIs are originating from the UE, US and Japan, while BRIC countries –led by China-- are the main "attractors", together with EU and US. FDIs in R&D are concentrated mainly in 3 sectors: IT Hardware, Automobile and Parts, and Pharmaceuticals & Biotechnology. Main results from the 2013 EU R&D Survey The 2013 EU Survey on Industrial R&D Investment Trends, published today, presents the main findings of the eighth survey on industrial R&D investment trends. It analyses the 172 responses of mainly large firms from the expanded sample of 1000 EU-based companies investing the largest R&D amounts analysed in the 2012 EU Industrial R&D Investment Scoreboard. In total, the 172 responding companies are responsible for R&D investment of almost € 62 billion. This is equivalent to around 41 % of the total R&D investment by the 1000 EU Scoreboard companies. The main findings of the survey are as follows: Long-term employment figures refer to a set of 1295 companies that reported number of employees over the whole period 2004-2012, breakdown into groups of industrial sector by R&D intensity (R&D as % net sales): High R&D intensity sectors (above 5%) Mediumhigh R&D intensity sectors (between 2% and 5%) Medium-low R&D intensity sectors (between 1% and 2%) Low R&D intensity sectors (less than 1%). 2 6 Between 2013-15, the responding companies expect to increase their R&D investments by 2.6 % on average per year. Due to decreased expectations in the automobiles & parts sector, this is a third lower than in the previous survey (4%). Figure 2: Expected changes of R&D investment of the surveyed companies 2013-15. Source: 2013 EU Survey on Industrial R&D Investment Trends, European Commission, JRC/DG RTD. The companies in the sample carry out a quarter of their R&D outside the EU. The largest share of R&D investment outside the EU is in the US and Canada (10 %), followed by rest of the world (5 %), China (4 %), Japan (2 %), other European countries (2 %), and India (1 %). Their expectations for R&D investment for the next three years show continued participation of European companies in the global economy, in particular growth opportunities in emerging economies, while maintaining an R&D focus in the EU. Two thirds of the European companies in the sample state their home country as the most attractive location for R&D. The US, Germany, China and India are as the most attractive locations outside the home country. Knowledge-sharing, human resources, proximity to other company sites and market demand make countries attractive for R&D activities. Knowledge-sharing and collaboration opportunities are an important factor of country attractiveness not only for companies. They are widely recognised as a priority issue in many Member States and for completing the European Research Area (ERA). 7 Source: 2013 EU Industrial R&D Investment Scoreboard. European Commission, JRC/DG RTD. 8


