doan-proj2 - Cal State LA
Introduction
As engineers, we are bounded by our beliefs to improve the daily things in life.
Improving the efficiency is the main goal of most engineers because this will lead to higher results with minimal amount of effort or work. Hence, this study is to explore this idea of efficiency and what we can do with it. The problem involves a pump and a turbine, which are devices use to raise water to a height or power for usage. The problem is to calculate the efficiency and other required coefficients to be able to predict the outcomes of a similar but larger device.
Models
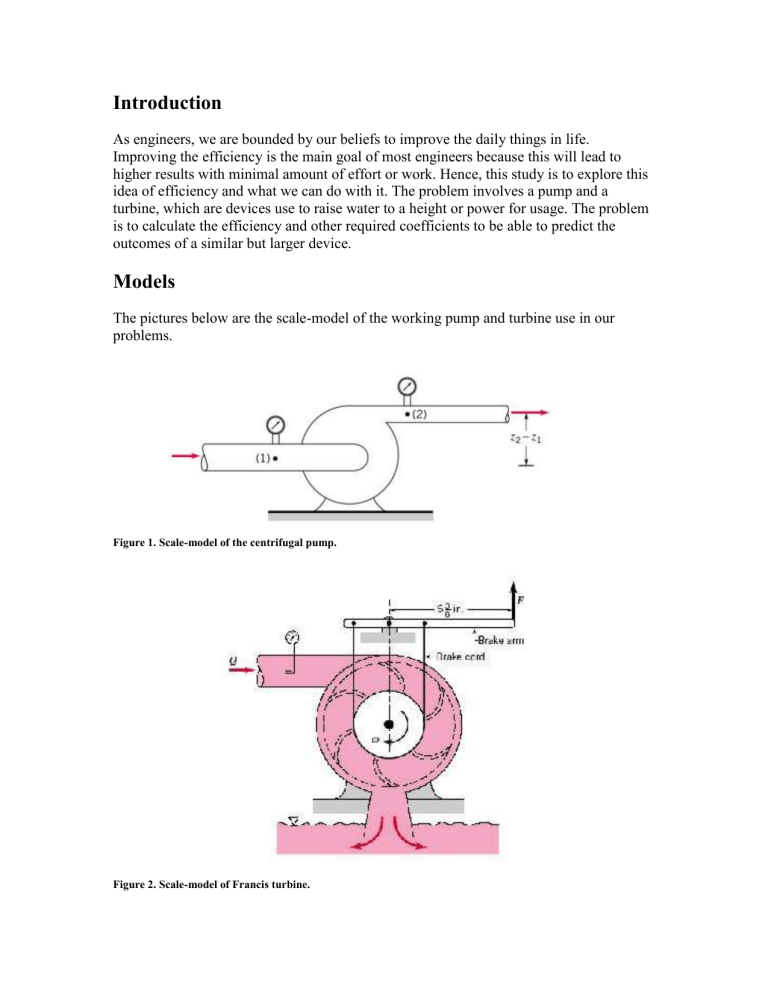
The pictures below are the scale-model of the working pump and turbine use in our problems.
Figure 1. Scale-model of the centrifugal pump.
Figure 2. Scale-model of Francis turbine.
The working fluid for the problem is tap water. Hence, we can attain the properties of water at assume temperature of 70°F, which is roughly the room temperature. From
Figure 1, the picture of the pump, we can clearly see where position 1 and position 2 are placed; this is where we are applying the energy equation. As for the Francis turbine, we will take the inlet of the turbine to be position 1 and the surface of the water as our position 2. This assumption will allow us to assume that the pressure at position 2 is zero gauge pressure and the velocity at point 2 is also zero, due to slow moving water at the surface. From the established data we have:
1 .
936 slug ft
3
62 .
30 lb ft
3
1 .
052
10
5 ft
2 s g
ft
32 .
2 s
2
For the centrifugal pump we are given the following size:
D impeller
0 .
75 ft d inlet
0 .
208 ft d outlet
0 .
125 ft z
2
z
1
0 .
5 ft
188 .
5 rad s
For the Francis turbine we are given the following information:
D impeller
0 .
583 ft d inlet
0 .
125 ft z
2
z
1
8 ft h total in
33 ft
Arm
0 .
531 ft
Theory
Using the given flow rate data, we can determine the velocities at the inlet and outlet of the centrifugal pump from the relationship:
Q
A
1
V
1
A
2
V
2
With the given raw data we are to obtain several empirical data to calculate the necessary values to predict the flow of a similar device. First we must calculate the head rise h a
, which is also called pump head, using the energy equation: h a
P
2
P
1
z
2
z
1
V
2
2
2
g
V
1
2
We will also need to calculate the efficiency of the pump with respect to the flow rate because we are running our device at different flow rates and ultimately to determine the optimal flow rate.
pump
Qh
sh a
turbine
sh
Qh
T
h
T h i h i p
sh
Q h i
T
h total h
T
sh
Q
P f
Qh a
The P f
is the power gained by the fluid and W sh
is the shaft power input. In order to predict the design flow rate of a similar device, we have to obtain the flow coefficient
(C
Q
), head rise coefficient (C
H
), and the power coefficient (C
P
). These coefficients are constants for similar devices hence we can relate the scale-model to that of the real thing.
C
Q
Q
D
3
C
Q
C
P
gh a
2
D
sh
3
D
2
5
These coefficients are also used for turbine. Using these equations, we can determine the flow rate, the head rise and the power required for a similar device operating at a different speed or different impeller diameter.
C
P
C
Q
C
H
Q
D
3
1
gh a
2
D
2
1
Q
D
3
2
gh a
2
D
2
2
sh
3
D
5
1
sh
3
D
5
2
Calculation and Discussion
This section will discuss and presents graphs of both the centrifugal pump and the Francis turbine. Upon using the graphs, we can predict the flow rate and power required for the larger scale model. First we will discuss the centrifugal pump and its performance characteristics.
Centrifugal Pump
Below is the graph presenting the efficiency and head rise of the scaled-model pump that will be use to determine the optimal/ design flow rate.
Centrifugal Pump
Performance Graph
70
40
30
20
10
70
60
50
100
90
80
0
0 0.05
0.1
0.15
Flow Rate (Q)
0.2
Efficiency Pump Head
Figure 3. Performance graph of centrifugal pump.
0.25
0.3
60
50
40
30
20
10
0.35
0
According to the graph above, we can see that the efficiency curve has a maximum rise; hence, that is where the maximum efficiency occurs and we can determine that with calculus. From the curve, we can interpolate and curve fit an equation:
pump
( x )
-798105
x
6
+ 917005
x
5
426664
x
4
+ 99356
x
3
12362
x
2
+ 1000.8
x + 2.5865
Where x is the flow rate of the pump. By taking the derivative of the top equation and setting it equal to zero, we can determine what the design flow rate for maximum efficiency. d
pump
( x )
0 dx
Q design
0 .
256 ft
3 s h a d esign
80 ft
W sh design
1850 lb
ft s
Using the establish equations to calculate the different coefficients, we can plot the coefficients with the flow rate coefficients. The graph below represents the different empirical coefficients in log scale.
Dimensionless Characteristic Curves
1
0.1
0.01
0.001
0.0001
0 0.0005
0.001
0.0015
0.003
0.0035
0.004
0
0.0045
0.002
0.0025
Flow Coeff
Head Rise Coeff.
Power Coeff.
Efficiency
Figure 4. Dimensionless characteristic curves.
Using the relationship between the two devices, we can determine the design flow rate, the head rise and the power needed with the already calculated design values for the scale-model pump.
Q design
2
Q
D
3
1
2
Q design
2
85 .
33 ft
3 s h a
2
2 h a a h a
D
2
1
2 D 2
2
888 .
79 ft
sh
2
6 .
85
3
sh
10
D
5
6 lb
1 ft s
3
D
5
2
12455 .
9 hp sh
2
From the calculated values, we can clearly see that by enlarging the pump to ten times the flow rate increases significantly and the power required to run the pump is enormous comparing to the value attained for the scale-model pump. By enlarging the pump ten times, the total head rise also increased ten times.
0.5
0.4
0.3
0.2
0.1
0.7
0.6
Francis Turbine
The Francis turbine is a similar device to the centrifugal pump in that it’s basically the same machinery but with different usage. Below is the graph of the efficiency of the
Francis turbine. Using the efficiency curve, we can determine the optimal rotational speed to maximize the efficiency. The maximum efficiency is where the efficiency curve flats out; this is where we should run the turbine for maximum productivity.
Francis Turbine
Efficiency Graph
1.6
0.9
1.4
1.2
1
0.8
0.6
0.4
0.2
0
0 50 100 150
Rotaional Speed (rad/s)
200 250 300
0
Torque Efficiency
Figure 5. Francis turbine efficiency and torque graph.
After calculating the flow, power and head coefficients, we plotted the results to further analyze the performance aspects of the Francis turbine. The graph below shows the relationship between the dimensionless coefficients: flow, head rise, power coefficients and efficiency.
0.8
0.7
0.6
0.5
0.4
0.3
0.2
0.1
Francis Turbine
Performance Characteristics Graph
1
0.1
0.9
0.8
0.7
0.01
0.6
0.5
0.001
0.0001
0.4
0.3
0.2
0.00001
0.1
0.000001
0 0.001
0.002
0.005
0.006
0
0.007
0.003
0.004
Flow Coeff. (CQ)
Head Coeff Power Coeff.
Efficiency
Figure 6. Dimensionless Characteristic Curves of the Francis turbine.
The prototype turbine to be built is 20 times larger in diameter and a total head of 99 feet will be available at the inlet. We are to predict the maximum power that can be generated by this turbine. In order to calculate the maximum power, we have to determine the optimal rotational speed for maximum efficiency. From Figure 5, we can interpolate the efficiency curve with an equation and similarly to the pump we got.
turbine
(x) =
8
10
-10 x
4
3
10
-7 x
3
4
10
-5 x
2
+
0.0066
x
+ 0.0002
Where x is the rotational speed of the turbine. By taking the first derivative of the equation above and setting it equal to zero, we can determine the optimal rotational speed. d
turbine
( x )
0 dx
design
208 .
83 rad s
max
0 .
77
Q design
1
0 .
133 ft
3 s h
T
1
27 .
5 ft
236 .
4 lb
ft s sh
1
Assuming that the performance characteristic coefficients are the same for the scalemodel and the prototype, we can use the power coefficient to determine the new generated power. Since, the efficiency of the prototype and the scale-model is the same, we can assume that they will have similar coefficients. Using the head rise coefficient we can determine the new operating rotational speed. It’s given that the new total head is 99 feet; hence, the ideal head rise is
1
2 h i
2
99
20
8
12
112 .
33 ft h
T
2
max
h i
2
86 .
49 ft
1
2
2
h
T
2
h
T
1
1
2
D
2
1
D
2
2
2
18 .
47 rad s
Q design
2
Q design
2
1
Q
D
3
1
2
94 .
35 ft
3 s sh
2 sh
2
3
sh
D
5
527388
1 lb
ft s
3
D
5
2
958 .
8 hp
From the calculated data, we can see that it’s going to generate a huge amount of power due to its increase in size.
