DobbinChapter5.1Samp..
advertisement
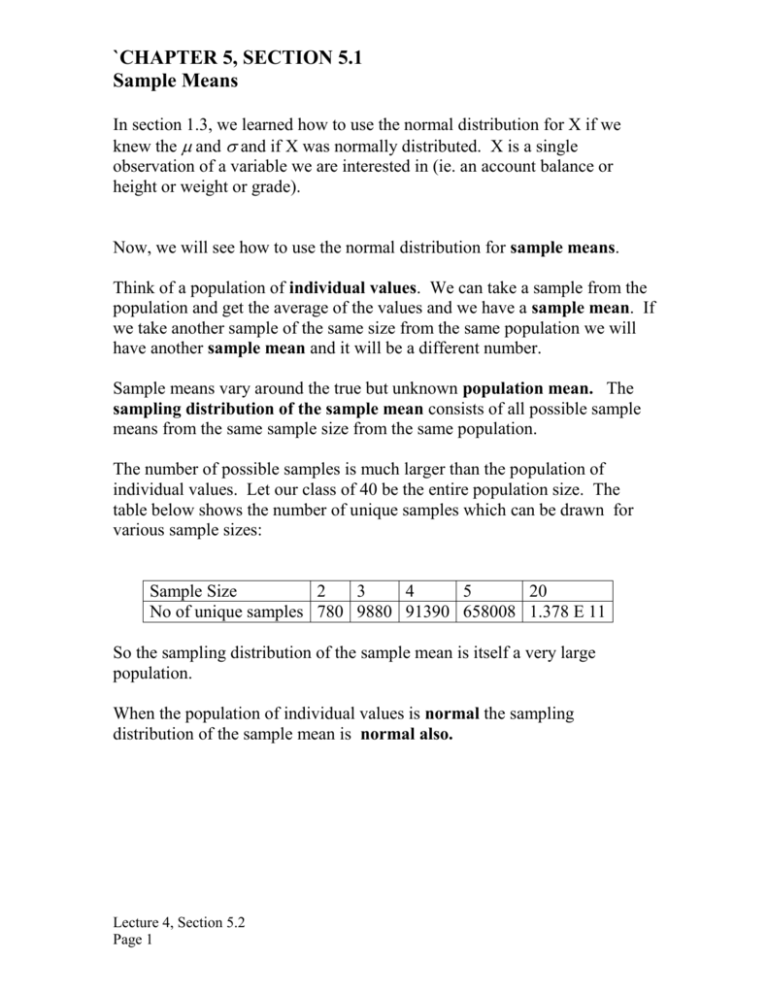
`CHAPTER 5, SECTION 5.1 Sample Means In section 1.3, we learned how to use the normal distribution for X if we knew the and and if X was normally distributed. X is a single observation of a variable we are interested in (ie. an account balance or height or weight or grade). Now, we will see how to use the normal distribution for sample means. Think of a population of individual values. We can take a sample from the population and get the average of the values and we have a sample mean. If we take another sample of the same size from the same population we will have another sample mean and it will be a different number. Sample means vary around the true but unknown population mean. The sampling distribution of the sample mean consists of all possible sample means from the same sample size from the same population. The number of possible samples is much larger than the population of individual values. Let our class of 40 be the entire population size. The table below shows the number of unique samples which can be drawn for various sample sizes: Sample Size 2 3 4 5 20 No of unique samples 780 9880 91390 658008 1.378 E 11 So the sampling distribution of the sample mean is itself a very large population. When the population of individual values is normal the sampling distribution of the sample mean is normal also. Lecture 4, Section 5.2 Page 1 The Sampling Distribution of a Sample Mean Sample means are less variable than individual observations, because in any sample there will be high values and low values which tend to offset each other, keeping the mean or average near the population mean. The larger the sample size, the smaller the variation of the mean becomes, and the closer the sample mean stays to the population mean. Sample means are more normally distributed than individual observations are, and if the sample size is large enough, the distribution of the sample means will be very close to a Normal Distribution even when the population of individual values is strongly skewed. This is the Central Limit Theorem. As a result, of the above, the Normal Distribution can be used to calculate probabilities of sample means when the population distribution is normal (or when it is not, per the Central Limit Theorem (CLT). Mean, Standard Deviation, and Distribution of the Sample Mean Let x be the mean of an SRS of size n from a population having mean and standard deviation . The mean and standard deviation of x are x x n If a population has the normal distribution, X = N ( , ) , then the sample mean x of n independent observations is also normally distributed, x = N (, / n ) . Formula we use for Z: Z Lecture 4, Section 5.2 Page 2 X x x Examples: 1. (5.32) The scores of students on the ACT college entrance examination in 2001 had mean 21.0 and standard deviation 4.7 . The distribution of scores is only roughly normal. a. What is the approximate probability that a single student randomly chosen from all those taking the test scores 23 or higher? b. Now take an SRS of 50 students who took the test. What are the mean and standard deviation of the sample mean score , x , of these 50 students? c. What is the approximate probability that the mean x of these students is 23 or higher? d. Which of your two normal probability calculations in (a) and (c) is more accurate? Why? Lecture 4, Section 5.2 Page 3 2. Bob is playing in the club golf tournament. Bob’s score varies as he plays the course repeatedly and his score has a N(77,3) distribution. a. What is the probability that Bob will shoot a 74 or lower in the first round of the club tournament? b. What is the probability that Bob will average 74 or lower for the 4 rounds of the club tournament? Central Limit Theorem The sampling distribution of x is normal if the population of individual values has a normal distribution. What if the population distribution is not normal? The Central Limit theorem says that: as the sample size increases, the distribution of x becomes closer and closer to a normal distribution. Draw an SRS of size n from any population with mean µ and standard deviation σ. When n is large, (30 or larger) the sampling distribution of the sample mean x is approximately normal: x is approximately N ( , ) with µ = µ of population and n with σ = σ of population / √ (sample size). Example: The number of accidents per week at a hazardous intersection varies with mean 2.2 and standard deviation 1.4. This kind of distribution is usually right skewed. Let x be the mean number of accidents per week at the intersection during a year (52 weeks). Lecture 4, Section 5.2 Page 4 a. What is the approximate distribution of x according to the central limit theorem? b. What is the approximate probability that x is less than 2? c. What is the approximate probability that there are fewer than 100 accidents at the intersection in a year? (Hint: Restate this event in terms of x .) Example: Household income is probably a right skewed distribution. If the government wanted to determine the average household income, the sample size should be at least 30 so that the sample mean would behave as a normally distributed statistic. And, the larger the sample size, the closer to normal the distribution becomes. Lecture 4, Section 5.2 Page 5 Suppose that last year the population of individual households had a mean annual income of $40,000 and a standard deviation of $20,000. a. Assuming that the income distribution is unchanged, what is the distribution of the sample mean when n=100 households? b. If the assumed figures are still correct for this year, what is the probability that a new sample mean for 100 households will be lower than $35000? c. What is the probability that the sample mean will fall between $35000 and $45000? d. What value of the sample mean would represent the 95th percentile? ie, find a value that would only be exceeded by 5% of the new samples of size 100. Lecture 4, Section 5.2 Page 6
