Stats: Sampling Distribution
advertisement
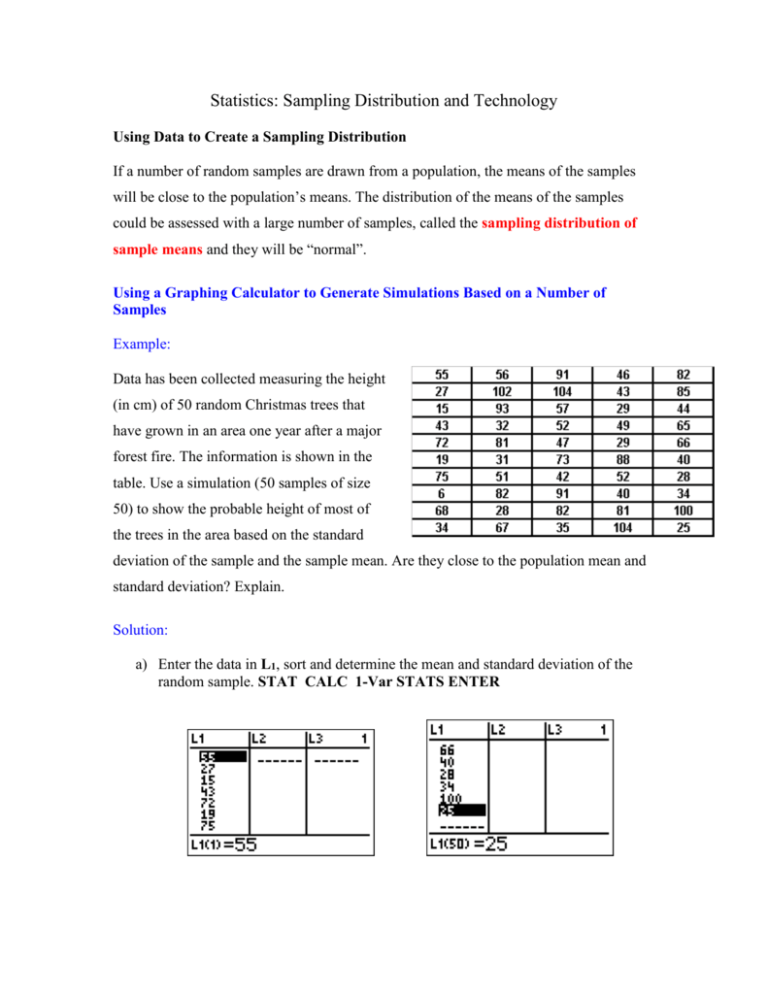
Statistics: Sampling Distribution and Technology Using Data to Create a Sampling Distribution If a number of random samples are drawn from a population, the means of the samples will be close to the population’s means. The distribution of the means of the samples could be assessed with a large number of samples, called the sampling distribution of sample means and they will be “normal”. Using a Graphing Calculator to Generate Simulations Based on a Number of Samples Example: Data has been collected measuring the height (in cm) of 50 random Christmas trees that have grown in an area one year after a major forest fire. The information is shown in the table. Use a simulation (50 samples of size 50) to show the probable height of most of the trees in the area based on the standard deviation of the sample and the sample mean. Are they close to the population mean and standard deviation? Explain. Solution: a) Enter the data in L1, sort and determine the mean and standard deviation of the random sample. STAT CALC 1-Var STATS ENTER Mean = 56.82 Standard Deviation = 26.11 b) Simulate the collection of 50 samples of size 50 and calculate the sample means to serve as an approximation of the sampling distribution of the sample mean. Enter these keystrokes: 2nd STAT OPS seq(#5) ENTER 2nd STAT MATH mean(#3) ENTER MATH PRB randNorm( ENTER 56.82, 26.11, 50)), A, 1, 50) STO L2 ENTER (this will take several minutes). You have now generated a simulation that uses the known sample mean and standard deviation to create 50 sample means (increased your sample size with a sampling distribution). c) Sort L2 and compare the sample mean to the population mean using STAT CALC 1-Var STATS. (choose L2). The numbers should be close. 56.19 56.82 d) Divide the population standard deviation by the √n (n = sample size). 26.11 ÷ √50 = 3.69 This number (3.69) should be close to the standard deviation of the sample means (3.32). This means that the probable height of most trees in the area is about 56cm and the approximate height will fall between 53 and 60 cm. If you collect all possible samples, calculate the mean for each, then make a list of the means, you will have a Sampling Distribution of Sample Means. Central Limit Theorem The normal distribution is one which appears in a variety of statistical applications. One reason for this is the Central Limit Theorem. This theorem tells us that sums of random variables are approximately normally distributed if the number of observations is large. Example: If we toss a coin, the total number of heads approaches normality if we toss the coin a lot of times. More trials will give a more normal result and be more normally distributed.
