RESEARCH METHODS – BS157 & BS158
advertisement
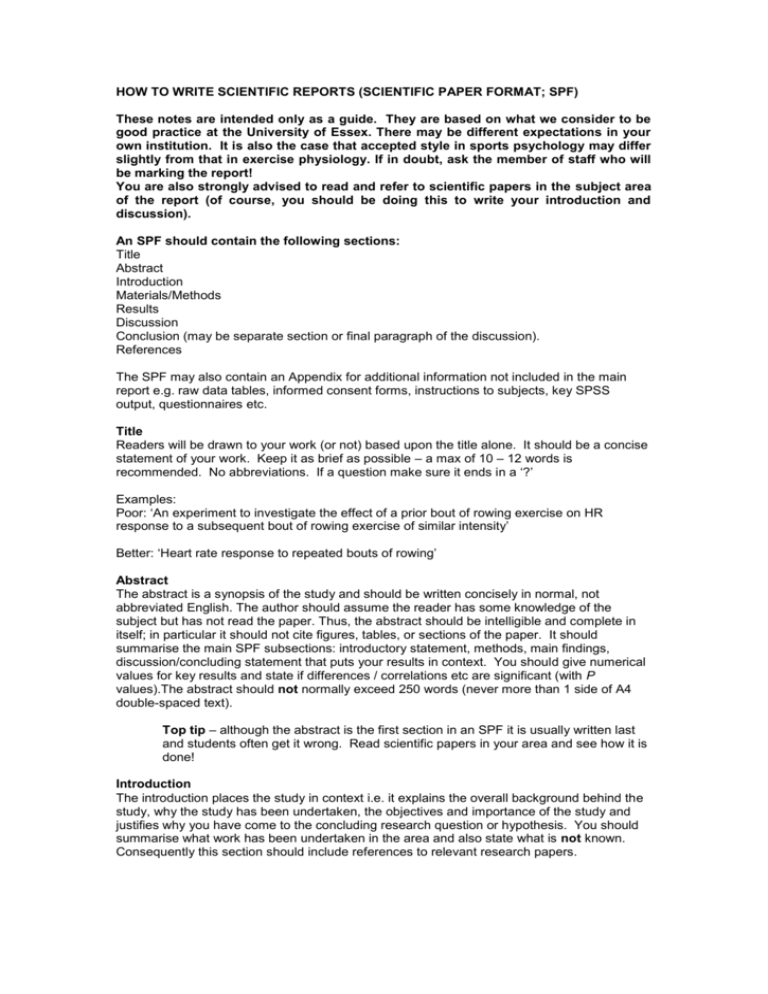
HOW TO WRITE SCIENTIFIC REPORTS (SCIENTIFIC PAPER FORMAT; SPF) These notes are intended only as a guide. They are based on what we consider to be good practice at the University of Essex. There may be different expectations in your own institution. It is also the case that accepted style in sports psychology may differ slightly from that in exercise physiology. If in doubt, ask the member of staff who will be marking the report! You are also strongly advised to read and refer to scientific papers in the subject area of the report (of course, you should be doing this to write your introduction and discussion). An SPF should contain the following sections: Title Abstract Introduction Materials/Methods Results Discussion Conclusion (may be separate section or final paragraph of the discussion). References The SPF may also contain an Appendix for additional information not included in the main report e.g. raw data tables, informed consent forms, instructions to subjects, key SPSS output, questionnaires etc. Title Readers will be drawn to your work (or not) based upon the title alone. It should be a concise statement of your work. Keep it as brief as possible – a max of 10 – 12 words is recommended. No abbreviations. If a question make sure it ends in a ‘?’ Examples: Poor: ‘An experiment to investigate the effect of a prior bout of rowing exercise on HR response to a subsequent bout of rowing exercise of similar intensity’ Better: ‘Heart rate response to repeated bouts of rowing’ Abstract The abstract is a synopsis of the study and should be written concisely in normal, not abbreviated English. The author should assume the reader has some knowledge of the subject but has not read the paper. Thus, the abstract should be intelligible and complete in itself; in particular it should not cite figures, tables, or sections of the paper. It should summarise the main SPF subsections: introductory statement, methods, main findings, discussion/concluding statement that puts your results in context. You should give numerical values for key results and state if differences / correlations etc are significant (with P values).The abstract should not normally exceed 250 words (never more than 1 side of A4 double-spaced text). Top tip – although the abstract is the first section in an SPF it is usually written last and students often get it wrong. Read scientific papers in your area and see how it is done! Introduction The introduction places the study in context i.e. it explains the overall background behind the study, why the study has been undertaken, the objectives and importance of the study and justifies why you have come to the concluding research question or hypothesis. You should summarise what work has been undertaken in the area and also state what is not known. Consequently this section should include references to relevant research papers. When discussing others’ work use a constructive and objective tone e.g. ‘Bloggs (2008) study was severely flawed’ is rather harsh and somewhat presumptuous. Be more constructive …’The results of Bloggs (2008) may be questioned due to…x’. The introduction should end with a concluding paragraph that summarises the aims of the study, the research question and any hypothesis/es. The funnel model is a useful way to structure most introductions: GENERAL…. SPECIFIC…. Begin by describing relevant ‘general theory’. However remain focused and do not attempt to include everything. Next present others’ findings and explain how you intend to extend or modify them. Provide support for your argument then specify the research question. Always end with the HYPOTHESIS Regarding hypotheses: Via your introduction you may be able to construct some hypotheses regarding what you think should happen in your study. A hypothesis is NOT a question and should not be vague e.g. ‘the intervention will improve running performance’ is too vague. Both the independent variable (intervention) and dependent variable (what we are measuring) must be precisely stated. e.g. ‘It is hypothesised that warm-up will decrease 400m running time’ is better. In this example the independent variable ‘warm-up’ has been stated, the dependent variable ‘400m running time’ has been identified and the direction of the change has been specified (decrease). If possible in a hypothesis you should always try to predict a direction. Use ‘increase/decrease, bigger/smaller, faster/slower rather than ‘improve’, ‘better’, ‘worse’. n.b. IF you predict an effect but not a direction then this is a two-tailed hypothesis and the P value must be less than 0.05 to achieve significance. If you predict the direction of the difference (for a logical reason) then the test is one-tailed and you can divide the calculated P by 2 before determining the level of significance (e.g.< 0.05).. Methods This section describes the procedures of your study in just enough detail so that others can repeat your results. Always write in the third person past tense. NEVER provide a list of equipment/materials. You should only include detail that would affect the outcome of the experiment. e.g. wearing gloves while taking blood is to be expected and does not affect the results of the experiment. On the other hand, the equipment used to analyse the blood is important (manufacturer, make, model) as different machines might give different results. When the procedure is not standard more detail should be provided including theoretical justification for the steps. The Methods section can be divided simply into a number of subsections for example: Participants (Note that this is preferred over ‘subjects’ by some journals). Describe how participants were recruited, from what group (e.g. undergraduate students), the number of participants and their sex. Provide participant descriptive data (mean ± SD for age, stature and body mass (not weight) as minimum with appropriate SI units) and give other relevant information e.g. fitness levels, smoking habit, whether they are on any medication etc. Protocol/design Describe whether you used a between or within subjects design. Describe the number of conditions, whether there was a control, whether conditions were blind and counterbalanced, time between conditions etc. If your protocol was complicated you might consider using a figure (flow chard) to support the text and aid the reader. Specific variables (use the name of the variable as the subsection title!) If you are measuring a number of dependent variables then you may want a subsection on each eg. Anthropometric measurements, Pulmonary measures etc. Statistical analysis This section should give clear information about the statistical methods used to analyse the data sets that are reported in the results section. (n.b. in Psychology papers the statistics are often described in the results section). Again read a paper in your area and see how it is done! Results Results should be presented clearly and simply. Results MUST be text supported by tables and/or figures. You should never present results in tables/figures without describing the results in words and referring to the figures. Eg. ‘Warm-up decreased 400m running time (Table 1).’ Titles for tables and figures must be informative so that the reader can understand what the data are about without having to refer to the text. Use your judgement as to whether the results should be presented as figures or tables – never both. If presenting as figures, select the type of chart you will use carefully and always label all figures and tables correctly. Make sure that numerical results always have the correct units (SI); not only in the text, but also in tables or figures. Make sure you report any significance (P value) within the table or figure and explain in a footnote. If you have a lot of results then use subsections as for the methods section. If the methods section did not describe the statistics then these should be explained here e.g. ‘A paired samples t-test was used to compare 400m running times between groups‘ ; then report your results. When reporting your results the following points are essential. 1. ALWAYS include mean values and SD. Raw data usually goes into an appendix. 2. ALWAYS report P-value to the nearest level of significance e.g. ‘P<0.05’ not P=0.04322. Common increments are 0.05, 0.01, 0.005, 0.001 etc. 3. DO NOT DISCUSS YOUR RESULTS – simply report facts e.g. ‘x was faster than y’ NOT ‘x was faster than y because…..’ 4. SPSS sometimes gives P as 0.000; report as P<0.001 Remember these are the minimum guidelines. Sometimes the results of statistical analysis need to be expressed in more detail e.g. 65 ± 2 s, (t(8) = 4.5, P < 0.05). Check with your supervisor. Tips on tables and figures: Always include an appropriate title legend for each table and figure, number it and refer to it in your narrative e.g. Figure 1, Table 1, Table 2 etc. The title legend goes ABOVE a table but BELOW a figure. If you use non-standard abbreviations always use an explanatory footnote. When presenting mean values in a figure include 1 standard deviation error bars. Discussion The structure of the discussion is the reverse of the introduction. Begin by explaining your SPECIFIC results in non-statistical language and then more towards a more general interpretation of your results. DO NOT simply repeat the results section. You need to relate your results to the existing literature (that you have already summarised in your introduction). Do your results agree/disagree with others? If not then why not? Your own, justified, opinions should be apparent to the reader. You must comment on what your results add to the understanding of a subject. You can also comment on limitations of your study and/ or suggest modifications to your methods but this should NOT dominate the discussion. Do NOT rubbish your own work. Always end with a concluding paragraph (sometimes a section). Here you should draw together the main findings of the study and if appropriate indicate the practical relevance of your results. References All references should be cited in the text and listed alphabetically by first author surname in the reference list. Most references should be to peer reviewed journal articles (including reviews). References to text books and reliable internet sites (e.g. for government reports) should be used sparingly and selectively. Reference to Wikipedia and the un-reviewed web sites of self proclaimed experts is usually unacceptable. Referencing is tedious but must be done properly. Guidelines for referencing can be found in the UG handbook. Some excellent, comprehensive guides are available on the web. Try this one http://www.imperial.ac.uk/library/pdf/harvard_referencing.pdf NOW SPELL AND GRAMMAR CHECK YOUR WORK – both electronically AND manually. Some errors are not detected by a spell-checker e.g. too/to etc. ASK SOMEONE ELSE TO READ YOUR WORK – DOES IT MAKE SENSE? Appendices In a laboratory report, appendices often are included. One type of appendix that appears in laboratory reports presents information that is too detailed to be placed into the report's text. You may also wish to include here examples of informed consent forms that have been used or individual results. Your supervisor might also ask for selected statistical output to be included. __________________________________________________________________________ O max ’. Appendix 1. To create expressions such as ‘ V 2 Details may differ between versions of Word and different operating systems. The following applies to Microsoft Office Word 2003. 1. 2. 3. 4. 5. Click where you want to insert the equation in your document. On the Insert menu, click Object, and then click the Create New tab. Select Microsoft Equation 3.0. Click OK. Build the equation by selecting symbols from the Equation toolbar and by typing variables and numbers. From the top row of the Equation toolbar, you can choose from more than 150 mathematical symbols. From the bottom row, you can choose from a variety of templates or frameworks that contain symbols such as fractions, integrals, and summations. When you’ve done this once you can cut and paste OR be clever and use the Autocorrect option in ‘Tools’. AutoCorrect O max ). 1. Create and/or select the Symbol text you want to use (e.g. V 2 2. Go to Tools/AutoCorrect. 3. When the AutoCorrect window comes up, make sure the "Replace text as you type" box is checked. 4. If you have selected one of the Symbols, you should see it in the "With:" box. 5. Make sure the Formatted text button is selected by the "With:" box. 6. Your cursor should be in the "Replace:" box. Type in the text you want to use as the replacement text (e.g. VO2max). 7. Click on OK or Add. 9. Repeat for each of the Symbols you want to use. The symbols are entered into the AutoCorrect dictionary, and every time you type the AutoCorrect text, Word will automatically replace it with the appropriate symbol. Magic!
