IEEE Table & Figure Formatting Guide
advertisement
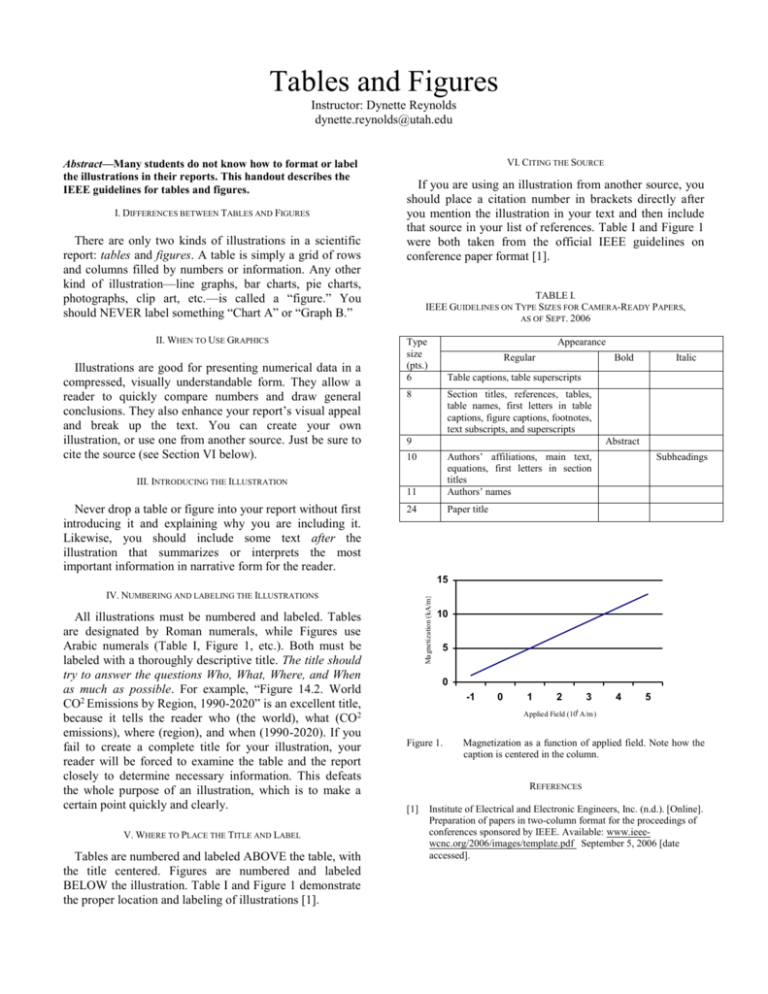
Tables and Figures Instructor: Dynette Reynolds dynette.reynolds@utah.edu Abstract—Many students do not know how to format or label the illustrations in their reports. This handout describes the IEEE guidelines for tables and figures. I. DIFFERENCES BETWEEN TABLES AND FIGURES There are only two kinds of illustrations in a scientific report: tables and figures. A table is simply a grid of rows and columns filled by numbers or information. Any other kind of illustration—line graphs, bar charts, pie charts, photographs, clip art, etc.—is called a “figure.” You should NEVER label something “Chart A” or “Graph B.” II. WHEN TO USE GRAPHICS Illustrations are good for presenting numerical data in a compressed, visually understandable form. They allow a reader to quickly compare numbers and draw general conclusions. They also enhance your report’s visual appeal and break up the text. You can create your own illustration, or use one from another source. Just be sure to cite the source (see Section VI below). VI. CITING THE SOURCE If you are using an illustration from another source, you should place a citation number in brackets directly after you mention the illustration in your text and then include that source in your list of references. Table I and Figure 1 were both taken from the official IEEE guidelines on conference paper format [1]. TABLE I. IEEE GUIDELINES ON TYPE SIZES FOR CAMERA-READY PAPERS, AS OF SEPT. 2006 Type size (pts.) 6 Appearance Regular Italic Table captions, table superscripts 8 Section titles, references, tables, table names, first letters in table captions, figure captions, footnotes, text subscripts, and superscripts 9 Abstract 11 Authors’ affiliations, main text, equations, first letters in section titles Authors’ names 24 Paper title 10 III. INTRODUCING THE ILLUSTRATION Never drop a table or figure into your report without first introducing it and explaining why you are including it. Likewise, you should include some text after the illustration that summarizes or interprets the most important information in narrative form for the reader. Bold Subheadings 15 All illustrations must be numbered and labeled. Tables are designated by Roman numerals, while Figures use Arabic numerals (Table I, Figure 1, etc.). Both must be labeled with a thoroughly descriptive title. The title should try to answer the questions Who, What, Where, and When as much as possible. For example, “Figure 14.2. World CO2 Emissions by Region, 1990-2020” is an excellent title, because it tells the reader who (the world), what (CO2 emissions), where (region), and when (1990-2020). If you fail to create a complete title for your illustration, your reader will be forced to examine the table and the report closely to determine necessary information. This defeats the whole purpose of an illustration, which is to make a certain point quickly and clearly. V. WHERE TO PLACE THE TITLE AND LABEL Tables are numbered and labeled ABOVE the table, with the title centered. Figures are numbered and labeled BELOW the illustration. Table I and Figure 1 demonstrate the proper location and labeling of illustrations [1]. Magnetization (kA/m) IV. NUMBERING AND LABELING THE ILLUSTRATIONS 10 5 0 -1 0 1 2 3 4 5 4 Applied Field (10 A/m ) Figure 1. Magnetization as a function of applied field. Note how the caption is centered in the column. REFERENCES [1] Institute of Electrical and Electronic Engineers, Inc. (n.d.). [Online]. Preparation of papers in two-column format for the proceedings of conferences sponsored by IEEE. Available: www.ieeewcnc.org/2006/images/template.pdf September 5, 2006 [date accessed].
