Review
advertisement
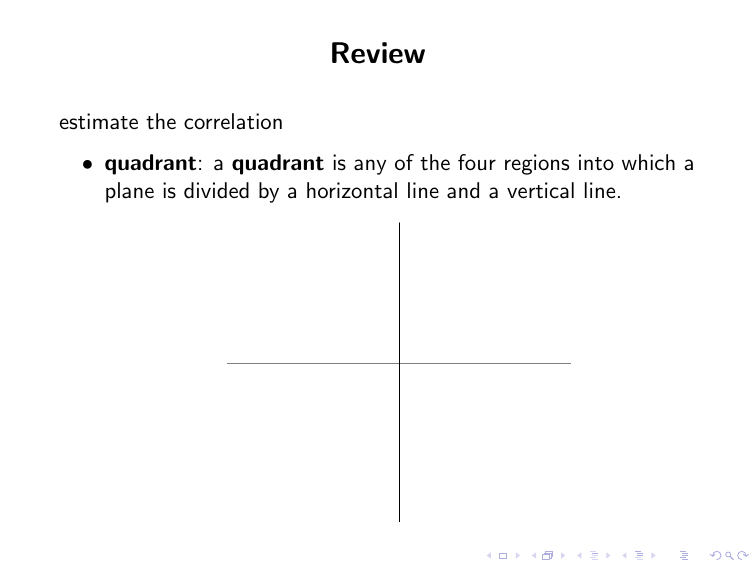
Review estimate the correlation • quadrant: a quadrant is any of the four regions into which a plane is divided by a horizontal line and a vertical line. Make Predictions • Regression Line: an equation for predicting the response outcome. The regression line predicts the value for the response variable y as a straight-line function of the value x of the explanatory variable. Let ŷ denote the predicted value of y . The equation for the regression line has the form ŷ = a + bx In the above formula, a denotes the y-intercept and b denotes the slope. • The y-intercept is the predicted value of y when x = 0. • The slope b is the amount that ŷ changes when x changes by one unit. • residual: the prediction error for an observation, which is the differency ŷ − y between the actual value and the predicted value of the response variable, is called a residual. Graphically in the scatterplot, the residual for an observation is the vertical distance between the point and the regression line. • Residual sum of squares: Residual sum of squares = X (residual)2 = X (y − ŷ )2 • Least Squares Method Among the possible lines that can go through data points in a scatterplot, this method gives the regression line that has the smallest value for the residual sum of squares in using ŷ = a + bx to predict y . • having some positive residuals and some negative residuals, but the sum (and the mean) of the residuals equals 0. • passing through the point (x̄, ȳ ). • The slope: sy b=r sx The y-intercept: a = ȳ − bx̄ • r-Squared (r 2 ) Interpretation: the proportion of the variation in the y-values that is accounted for by the linear relationship of y with x. Some Cautions in Analyzing Associations • Extrapolation is dangerous. Extrapolation refers to using a regression line to predict y values for x values outside the observed range of data. • Be cautious of influential outliers • Correlation does not imply causation.


