TI-83: Sample Mean & Standard Deviation Tutorial
advertisement
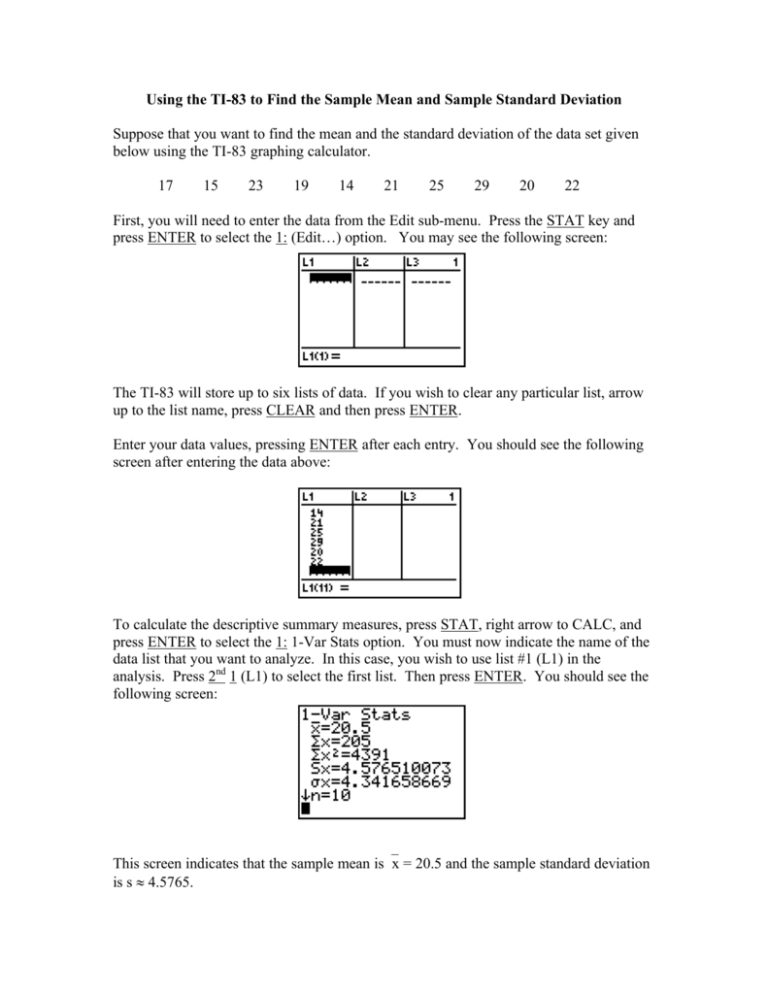
Using the TI-83 to Find the Sample Mean and Sample Standard Deviation Suppose that you want to find the mean and the standard deviation of the data set given below using the TI-83 graphing calculator. 17 15 23 19 14 21 25 29 20 22 First, you will need to enter the data from the Edit sub-menu. Press the STAT key and press ENTER to select the 1: (Edit…) option. You may see the following screen: The TI-83 will store up to six lists of data. If you wish to clear any particular list, arrow up to the list name, press CLEAR and then press ENTER. Enter your data values, pressing ENTER after each entry. You should see the following screen after entering the data above: To calculate the descriptive summary measures, press STAT, right arrow to CALC, and press ENTER to select the 1: 1-Var Stats option. You must now indicate the name of the data list that you want to analyze. In this case, you wish to use list #1 (L1) in the analysis. Press 2nd 1 (L1) to select the first list. Then press ENTER. You should see the following screen: This screen indicates that the sample mean isx = 20.5 and the sample standard deviation is s ≈ 4.5765.
