Chapter 2: Frequency Distributions
advertisement
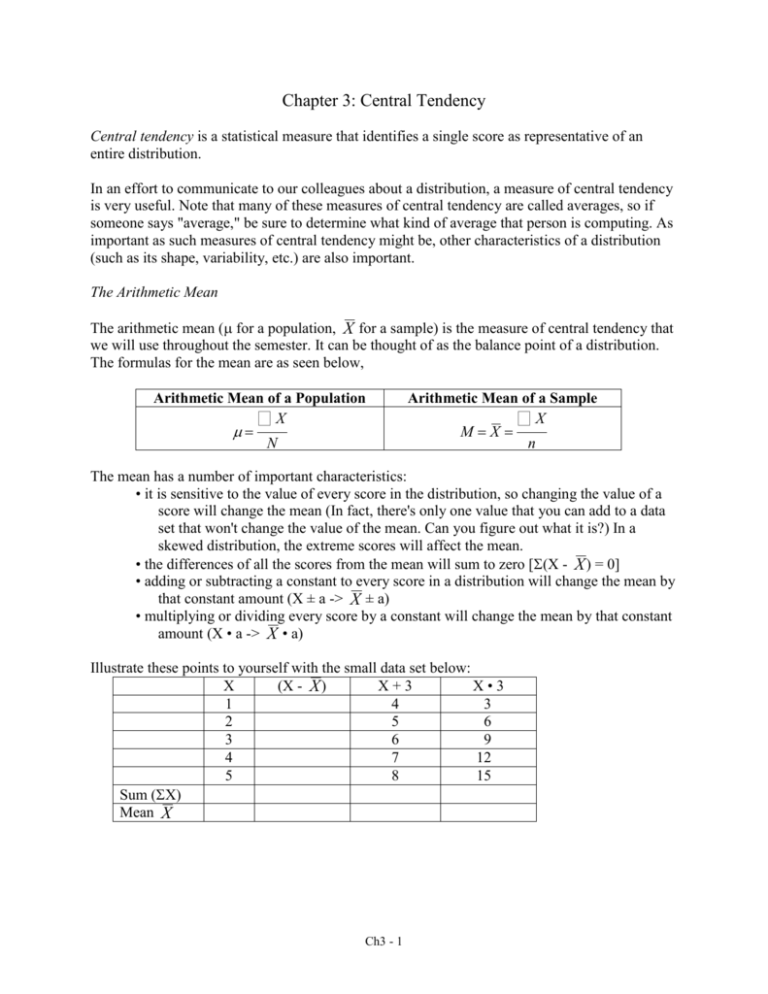
Chapter 3: Central Tendency Central tendency is a statistical measure that identifies a single score as representative of an entire distribution. In an effort to communicate to our colleagues about a distribution, a measure of central tendency is very useful. Note that many of these measures of central tendency are called averages, so if someone says "average," be sure to determine what kind of average that person is computing. As important as such measures of central tendency might be, other characteristics of a distribution (such as its shape, variability, etc.) are also important. The Arithmetic Mean The arithmetic mean ( for a population, X for a sample) is the measure of central tendency that we will use throughout the semester. It can be thought of as the balance point of a distribution. The formulas for the mean are as seen below, Arithmetic Mean of a Population åX m= N Arithmetic Mean of a Sample åX M=X= n The mean has a number of important characteristics: • it is sensitive to the value of every score in the distribution, so changing the value of a score will change the mean (In fact, there's only one value that you can add to a data set that won't change the value of the mean. Can you figure out what it is?) In a skewed distribution, the extreme scores will affect the mean. • the differences of all the scores from the mean will sum to zero [(X - X ) = 0] • adding or subtracting a constant to every score in a distribution will change the mean by that constant amount (X ± a -> X ± a) • multiplying or dividing every score by a constant will change the mean by that constant amount (X • a -> X • a) Illustrate these points to yourself with the small data set below: X (X - X ) X+3 X•3 1 4 3 2 5 6 3 6 9 4 7 12 5 8 15 Sum (X) Mean X Ch3 - 1 The Median The median is the score that divides a distribution exactly in half (50% of scores above and 50% of scores below). The median is equivalent to the 50th percentile. You would compute the median in the same fashion for populations and samples (though you'd almost never have all the scores from a population). Situation Odd number, with unique scores in middle Even number, with unique scores in middle Several scores with the same value in middle Computation order scores, pick the middle score order scores, calculate midpoint between the two middle scores order scores, interpolate by counting number of scores below the tied value (A), then determine the number of scores needed to make 50% (B), then compute the ratio (A/B) and add that ratio to the lower real limit containing the tied scores My own advice would be to use a computer program to compute the median. The median is not affected by the actual values of the scores. For instance, compute the median for the simple distributions below: 1, 2, 3, 4, 5 1, 2, 3, 4, 500 -500, -50, 3, 300, 900 Because the median is not affected by the actual values of the scores, it is appropriate for skewed distributions. The Mode In a frequency distribution, the mode is the score or category that has the greatest frequency. A single mode may not exist, which is one of many problems with using it as a measure of central tendency. Central Tendency and the Shape of a Distribution In a symmetrical, unimodal distribution, the mean, median, and mode will be the same. In a positively skewed distribution, the mean > the median > the mode. In a negatively skewed distribution, the mean < the median < the mode. Ch3 - 2

