Day 4
advertisement
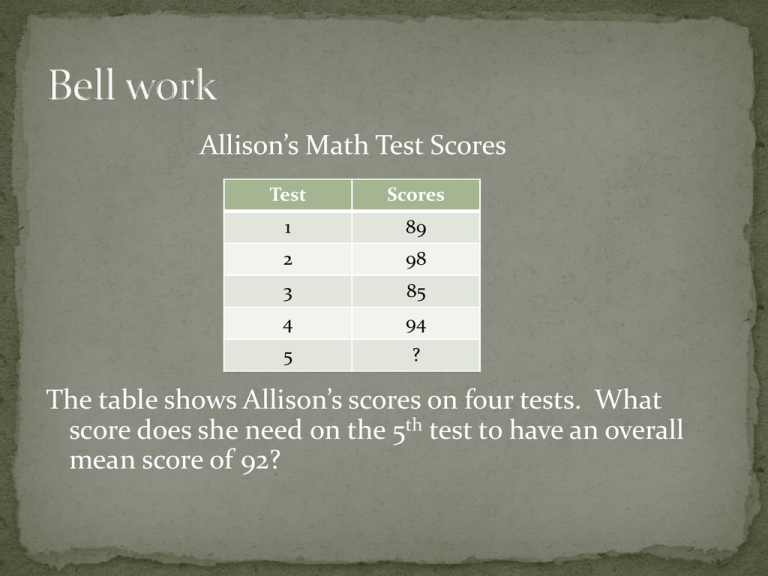
Allison’s Math Test Scores Test Scores 1 89 2 98 3 85 4 94 5 ? The table shows Allison’s scores on four tests. What score does she need on the 5th test to have an overall mean score of 92? 1. Add up the points for the first 4 test scores. 89 + 98 + 85 + 94 = 366 2. Find out how many points it would take to get a 92 average. 92 x 5 = 460 2. Subtract to find the points needed on the 5th test. 460-366 = 94 A set of data collected to answer a statistical question has a distribution which can be described by its center, spread, and overall shape. CENTER - A measure of center summarizes all of the values of a data set with a single number (mean, median, mode) SPREAD - Describes how spread out or varied the data is (range) OVERALL SHAPE – Skewed left, skewed right, normal distribution, uniform distribution, bimodal distribution Mean – also called the average, fair share or balance point of a set of data – it can be found using a leveling strategy or by finding the sum of the data divided by the number of pieces of data. Median – the middle number in a set of data ordered from smallest to largest. If the data set has an odd number of elements, the median is the single middle value. If the data set has an even number of elements, the median is the average of the two middle values. Mode – the number(s) that occur(s) most often (there can be more than one mode in a data set) Range – the difference between the greatest and least values of the set Mean Absolute Deviation- the absolute value of each data point from the mean of the data set Hey diddle diddle The median’s in the middle; You add and divide for the mean. The mode is the one that appears the most And the range is the difference between. Find the mean number of points scored. Find the median number of points scored. What do the values of the mean and median tell you about the overall shape or distribution of the data? Player Points Ethan 16 Collin 9 Nathan 10 Mason 4 Tyler 12 Aaron 8 Cole 2 Each of the 20 students in Mr. Anderson’s class timed how long it took them to solve a puzzle. Their times (in minutes) are listed below: Student 1 2 3 4 5 6 7 8 9 10 11 12 13 14 15 16 17 18 19 2 0 Time (in minutes 3 5 4 6 4 8 5 4 9 5 3 4 7 5 8 6 3 6 5 7 Display the data using a line plot. Find the mean and median of the data. Does it surprise you that the values of the mean and median are not equal? Explain why or why not. http://www.illustrativemathematics.org/illustrations/877 Bimodal Distribution Normal Distribution Uniform Distribution Skewed Right Skewed Left


