7-3 Statistics: Mean, Median, and Mode
advertisement
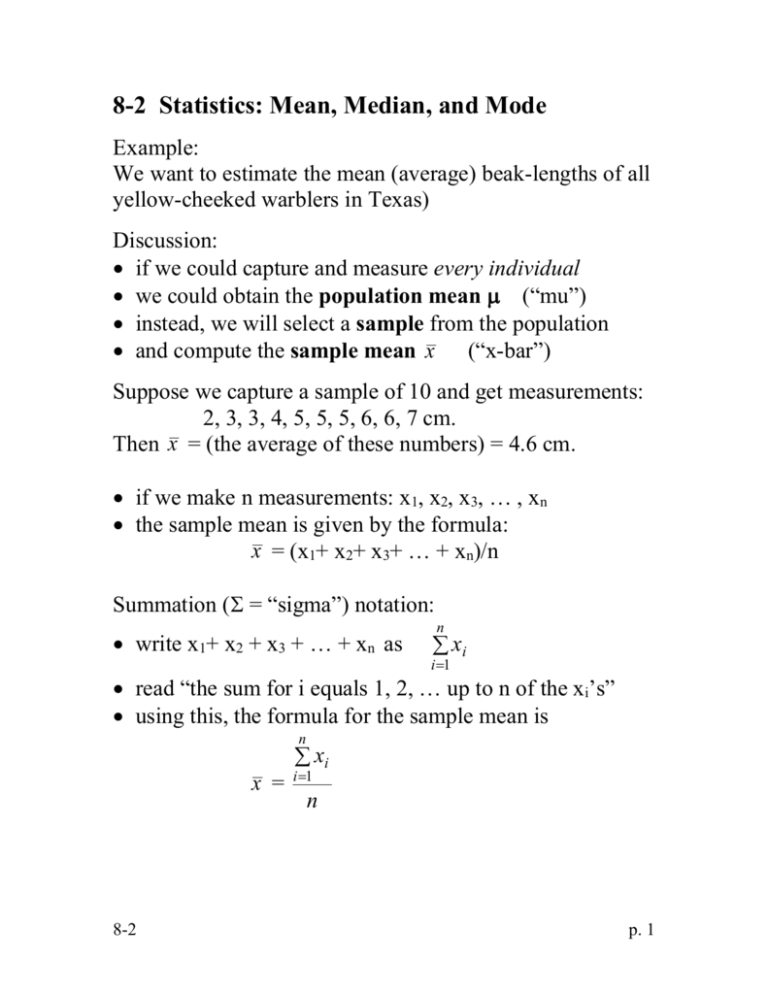
8-2 Statistics: Mean, Median, and Mode Example: We want to estimate the mean (average) beak-lengths of all yellow-cheeked warblers in Texas) Discussion: if we could capture and measure every individual we could obtain the population mean (“mu”) instead, we will select a sample from the population and compute the sample mean x (“x-bar”) Suppose we capture a sample of 10 and get measurements: 2, 3, 3, 4, 5, 5, 5, 6, 6, 7 cm. Then x = (the average of these numbers) = 4.6 cm. if we make n measurements: x1, x2, x3, … , xn the sample mean is given by the formula: x = (x1+ x2+ x3+ … + xn)/n Summation ( = “sigma”) notation: write x1+ x2 + x3 + … + xn as n xi i 1 read “the sum for i equals 1, 2, … up to n of the xi’s” using this, the formula for the sample mean is n xi x = 8-2 i 1 n p. 1 Some more terminology: we will frequently use the term score as the generic word for any kind of measurement or count things like sample mean that are computed based on a sample, are called statistics the mean is a measure of central tendency a single number that summarizes … some characteristic of a population there are other measures of central tendency … MEDIAN the median is the middle score of a set of scores … that have been placed in order if there is no middle score (i.e. there are an even number of scores) take the average of the two middle scores Example: 1, 3, 5, 6, 7, 8 has median 5.5 MODE the mode is the most frequently occurring score there may be more than one mode Example: 1, 3, 3, 3, 5, 6, 6 1, 3, 3, 3, 5, 6, 6, 6 8-2 has mode 3 has modes 3 and 6 p. 2 ANOTHER VIEW OF DISTRIBUTIONS For measurements (as opposed to counts) the graphical representation of the distribution of a r.v. X can look like: 2.5 3.0 x this kind of distribution is called a density function areas under the curve represent relative frequency of occurrence of ranges of values if the shaded area is 25% of the total area under the curve then 25% of the scores lie between 2.5 and 3.0 25% 2.5 8-2 3.0 x p. 3


