geostatistical modelling and estimation of qualitative
advertisement

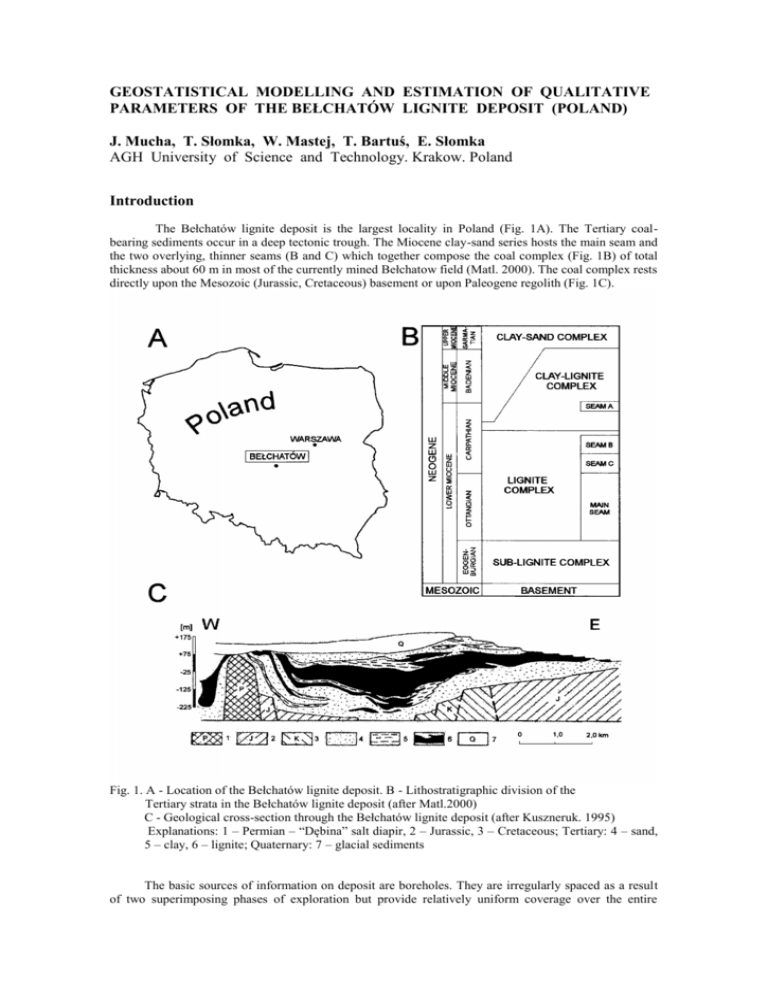
GEOSTATISTICAL MODELLING AND ESTIMATION OF QUALITATIVE PARAMETERS OF THE BEŁCHATÓW LIGNITE DEPOSIT (POLAND) J. Mucha, T. Słomka, W. Mastej, T. Bartuś, E. Słomka AGH University of Science and Technology. Krakow. Poland Introduction The Bełchatów lignite deposit is the largest locality in Poland (Fig. 1A). The Tertiary coalbearing sediments occur in a deep tectonic trough. The Miocene clay-sand series hosts the main seam and the two overlying, thinner seams (B and C) which together compose the coal complex (Fig. 1B) of total thickness about 60 m in most of the currently mined Bełchatow field (Matl. 2000). The coal complex rests directly upon the Mesozoic (Jurassic, Cretaceous) basement or upon Paleogene regolith (Fig. 1C). Fig. 1. A - Location of the Bełchatów lignite deposit. B - Lithostratigraphic division of the Tertiary strata in the Bełchatów lignite deposit (after Matl.2000) C - Geological cross-section through the Bełchatów lignite deposit (after Kuszneruk. 1995) Explanations: 1 – Permian – “Dębina” salt diapir, 2 – Jurassic, 3 – Cretaceous; Tertiary: 4 – sand, 5 – clay, 6 – lignite; Quaternary: 7 – glacial sediments The basic sources of information on deposit are boreholes. They are irregularly spaced as a result of two superimposing phases of exploration but provide relatively uniform coverage over the entire deposit area. The average spacing is about 140 m in the eastern part and 90 m in western part of the Bełchatów field (Fig. 2). Drill cores from each borehole had been sampled and assayed for ash and sulphur content, moisture and calorific value. These basic parameters control the quality of lignite deposit. W E 43000 42000 51000 52000 53000 54000 55000 56000 57000 [m] Fig. 2. Location of the boreholes in the central part of the deposit (Bełchatów field) Western part – first stage of exploration, eastern part – the first and second stages of exploration Scope of study, methods and data The study aimed to determine the accuracy of mean values estimations of above-mentioned qualitative parameters for mining fields scheduled for extraction in one year (about 0.6-0.7 km2). Prediction of the accuracy was carried on with the block kriging procedure based on detailed geostatistical analysis (Journel. and Huijbregts. 1978) of qualitative parameters variability preceded by classical statistical analysis. For simplicity it was assumed that the mining fields are squares of dimensions: 800x800m. From geological and mining-engineering practice results for which the relative error of mean parameters estimation does not exceed 5 % are regarded as fully satisfactory. The second purpose of the present study was to analyze the possible modification of measurement grid for qualitative parameters assessment, which might have decrease the number of samples taken from drill cores and, thus, might have led to the cost reduction of future exploration. Data originated from about 1,200 boreholes drilled in the Bełchatów field (Fig. 2). After inspection of the data some of them were rejected because of too low core recovery or too high sampling and analytical errors. Results Generally, lignite from the Bełchatów field is characterised by (Table 1): low calorific value (2187 kcal/kg = 9.2 MJ/kg, in average), low suphur content (0.63%, in average) but rather high moisture (46%, in average) and high ash content (11%, in average). Each parameter, especially sulphur content, shows strong skewness of the probability distribution. Relative variability of studied parameters expressed by the coefficient of variation is distinctly diversified (Table 1). Variabilities of the ash and sulphur contents are twice higher than those of calorific value and moisture. Table 1. Statistics of qualitative parameters of the Bełchatów lignite deposit Deposit parameter Data number Ash content (%) Sulphur content (%) Calorific value (kcal/kg) Moisture (%) 1157 1031 838 838 Mean value Standard deviation Coefficient of variation 11.4 0.63 2187 46.2 4.8 0.26 481 9.3 42 40 22 20 Skewness 1.48 2.16 1.48 -1.40 -1 (h)=0.052+0.15sph(h/1300) Ash content Relative semivariogram R(h) 0.2 Sulphur content (h)=0.07+0.104sph(h/2000) 0.15 0.1 (h)=0.04+0.011sph(h/2000) Calorific value 0.05 Moisture (h)=0.034+0.005sph(h/1300) 0 0 500 1000 1500 2000 2500 3000 3500 4000 Distance h [m] Fig. 3. Relative omnidirectional semivariograms of qualitative parameters and their models The general relative omnidirectional semivariograms (Isaaks. and Srivastava. 1989. p.164) of studied parameters can be satisfactorily approximated by the spherical models (Fig. 3). They show different nature of the structure of parameter variability expressed first of all by strongly differentiated values of nugget effects (Royle. 1991. p.39), from 26% for ash content, through 40% for sulphur content to 80% for calorific value and to 87% for moisture. It points out that in the geological practice variability of the calorific value and moisture can be treated as random. On the contrary, variability of the ash and sulphur contents is clearly non-random. Moreover, the directional semivariograms represented by semivariogram surface maps revealed a strong anisotropy of the ash and sulphur content variability with N-S being the direction of maximum variability and with perpendicular W-E direction of minimum variability (Fig. 4), and with isotropic style of calorific value and moisture variabilities. Therefore, the variability modelling of the two first parameters had to be repeated and anisotropic (geometrical) models were constructed (Fig. 5). Ash content 1000 1000 500 500 0 0 -500 -500 -1000 -2000 -1500 -1000 -500 0 500 1000 1500 2000 Sulphur content -1000 -2000 -1500 -1000 -500 [m] 0 500 1000 1500 2000 [m] Fig. 4.Contour maps of semivariogram surface for ash and sulphur contents Taking into account the results of statistical and geostatistical analyses, the block kriging procedure was applied for determining the accuracy of mean values estimation of ash and sulphur contents as the most variable qualitative parameters 0.25 0.3 Sulphur content Relative semiwariogram R(h) Relative semivariogram R(h) Ash content 0.2 N-S (h)=0.055+0.215sph(h/1500) 0.2 W-E (h)=0.055+0.215sph(h/3900) 0.1 0 N-S (h)=0.08+0.14Gaus(h/1600) 0.15 W-E (h)=0.08+0.14Gaus(h/3500) 0.1 0.05 0 0 500 1000 1500 2000 0 Distance h [m] 500 1000 1500 2000 Distance h [m] Fig.5 Directional semivariograms and anisotropic models of ash and sulphur content variabilities N – S - direction of maximum variability, W – E - direction of minimum variability Basing on isotropic (Fig.3) and anisotropic (Fig.5) models, the relative standard kriging errors were calculated for various, regular isotropic and anisotropic grids of boreholes (Table 2). For anisotropic grid its longer side was concordant with the direction of minimum variability (W-E). Table 2. Relative kriging standard errors (%) of mean ash and sulphur contents estimation within the calculation block 800x800m for various boreholes grids. Size of boreholes grid [m] Sampling density [N/km2] 100x100 200x100 150x150 200x200 300x150 400x200 100.0 50.0 44.4 25.0 22.2 12.5 Ash content Isotropic model 3.5 4.8 4.7 6.2 6.3 8.4 Anisotropic model 3.5 4.3 4.5 6.1 6.1 7.6 Sulphur content Isotropic model 3.6 4.4 4.6 6.0 6.5 7.9 Anisotropic model 3.5 4.3 4.4 5.9 6.5 7.6 The obtained results show that the satisfactory accuracy of mean parameter estimation within 800x800m mining block can be obtained for the grids 150x150m or 200x100m. Therefore, it is suggested that at the first stage of exploration the average borehole grid of about 140 m is sufficient for credible qualitative parameters estimation. Conclusions The credible recognition of geometry and structure of the Bełchatów lignite deposit requires the two-stage exploration. The obtained results demonstrate that, according to the presumed criteria, the 150x150m or 200x100m borehole grids ensure satisfactory accuracy of the estimation of mean qualitative parameters for the fields scheduled for extraction during one year. Consequently, the first stage of exploration (with an average boreholes spacing about 140m) already ensures the required estimation accuracy of qualitative parameters. If the two-stage exploration is considered, the same accuracy can be attained if qualitative parameters are measured in each second borehole along the W-E line, i.e., along the minimum variability direction for ash and sulphur contents. Therefore, it is possible to reduce by more than half the density of existing grid of measurements of qualitative parameters (with an average boreholes spacing 90m), which should significantly lower the costs of exploration. Acknowledgements The research project was financed by the University of Mining and Metallurgy grants No. 11.11.140.808 and 11.11.140.828. Sincere thanks are due to the staff members of the Geological Dept. of the Bełchatów Mine who provided data for the project. References Isaaks. E.H., and Srivastava. R.M., 1989. An Introduction to Applied Geostatistics : Oxford University Press., New York, 561 p. Journel. A.C., and Huijbregts. Ch. J., 1978. Mining Geostatistics: Academic Press., London, 600 p. Matl. K., 2000. Selected elements of the geological structure of the Bełchatów deposit (in Polish, English summary): Prace Geologiczne PAN. no.147.,Krakow, p.11-20. Royle. A.G., 1991. Kriging . in Dowd. P.A., ed., Leeds University Mining Association., Leeds, p.39-47.


