Useful Stata commands
advertisement
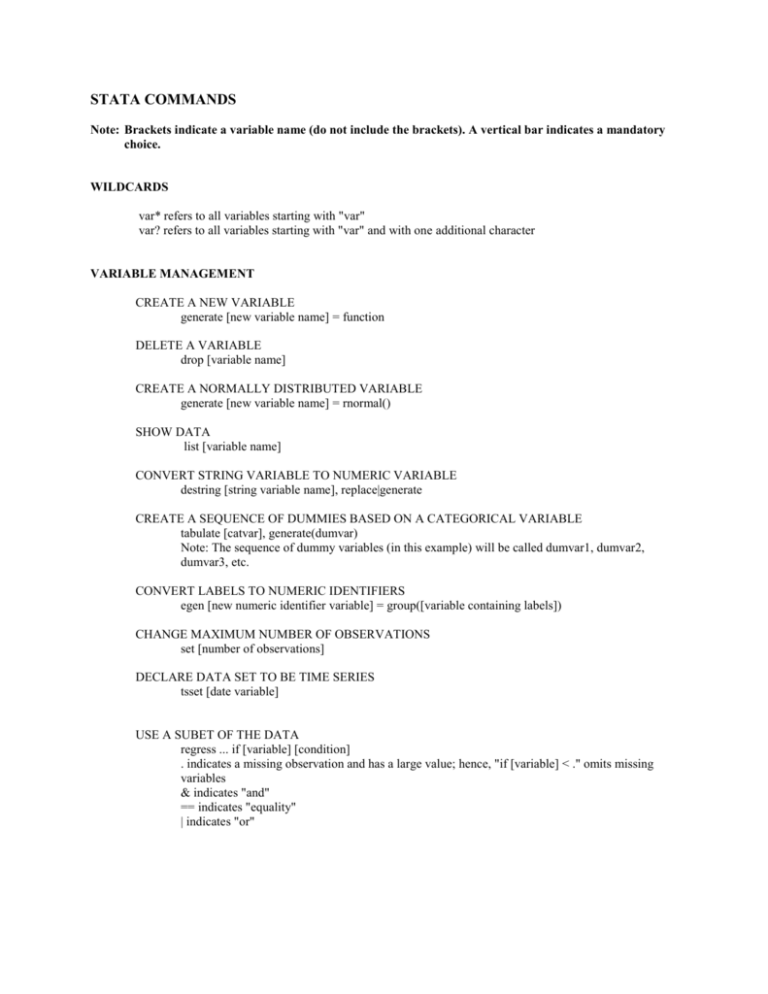
STATA COMMANDS Note: Brackets indicate a variable name (do not include the brackets). A vertical bar indicates a mandatory choice. WILDCARDS var* refers to all variables starting with "var" var? refers to all variables starting with "var" and with one additional character VARIABLE MANAGEMENT CREATE A NEW VARIABLE generate [new variable name] = function DELETE A VARIABLE drop [variable name] CREATE A NORMALLY DISTRIBUTED VARIABLE generate [new variable name] = rnormal() SHOW DATA list [variable name] CONVERT STRING VARIABLE TO NUMERIC VARIABLE destring [string variable name], replace|generate CREATE A SEQUENCE OF DUMMIES BASED ON A CATEGORICAL VARIABLE tabulate [catvar], generate(dumvar) Note: The sequence of dummy variables (in this example) will be called dumvar1, dumvar2, dumvar3, etc. CONVERT LABELS TO NUMERIC IDENTIFIERS egen [new numeric identifier variable] = group([variable containing labels]) CHANGE MAXIMUM NUMBER OF OBSERVATIONS set [number of observations] DECLARE DATA SET TO BE TIME SERIES tsset [date variable] USE A SUBET OF THE DATA regress ... if [variable] [condition] . indicates a missing observation and has a large value; hence, "if [variable] < ." omits missing variables & indicates "and" == indicates "equality" | indicates "or" REGRESSION OLS REGRESSION regress [dependent variable] [regressor 1] [regressor 2] ... [regressor N] OLS REGRESSION WITH HETEROSKEDASTICITY CORRECTION regress [dependent variable] [regressor 1] [regressor 2] ... [regressor N], vce(hc3) PANEL REGRESSION (GLS when using random effects) xtreg [dependent variable] [regressor 1] [regressor 2] ... [regressor N], [option] For [option], use RE for random effects, BE for time-specific fixed effects, and FE for crosssectional fixed effects. FITTED MEASURES, RESIDUALS, FORECAST STANDARD ERRORS FROM LAST REGRESSION Note: These commands generate residuals and forecasts based on the last run regression. OLS: Prediction: predict [new variable name] Forecast Standard Error: predict [new variable name], stdb Residuals: predict [new variable name], residuals Estimated covariance matrix: estat vce Panel Data: Residual plus fixed effects (total residual): predict [new variable name], ue Fixed effects (individual specific residual component): predict [new variable name], u Non-specific residual: predict [new variable name], e TESTS TEST FOR NORMALITY sktest [variable name] Note: The null hypothesis is normality. PORTMANTEAU (Q) TEST FOR SERIAL CORRELATION wntestq [variable name], lags(#) CORRELOGRAM corrgram [variable name] BREUSCH-PAGAN TEST FOR HETEROSKEDASTICITY hettest (run this after running a regression) TESTS FOR ENDOGENEITY estat endogenous (run this after running a regression) TRANSFORMATIONS D.[variable name] First difference in the variable L.[variable name] Variable lagged one period GRAPHING twoway (scatter [y1 variable] [y2 variable] ... [x variable]) plot [y variable] [x variable] OTHER SAVE COMMANDS AND OUTPUT log using [filename] Writes all subsequent commands and output to a file. log using [filename], text Writes all subsequent commands and output to a text file. log using [filename], noproc Writes all subsequent commands, but no output, to a file. log off Suspends logging. log on Resumes logging. log close Stops logging and closes the log file. RESTRICT OPERATION TO A SUBSET OF THE DATA [command] in [starting observation]/[ending observation] GENERATE CORRELATION MATRIX correlate [variable name, variable name, ...] SUMMARY MEASURES FOR VARIABLES summary [variable name, variable name, ...] Gives number of observations, mean, standard deviation, minimum value, and maximum value of all variables in the list summary Gives summary measures for all variables summary [variable name], detail Gives a large number of summary measures, including median, skewness, and kurtosis CALCULATOR display [arithmetic operation] Gives the result of arithmetic operations on two or more variables, i.e. +, -, /, *, ^. Also used for logarithmic (log(argument)) and exponential (exp(argument)) operations. display normal(z) Gives Pr(Z<z) for a standard normal variable Z. display invnormal(p) Gives the value z for which Pr(Z<z) equals p, Z~N(0,1) display ttail(n,t) Gives Pr(T>t) for a t-distributed variable T with n degrees of freedom display invttail(n,p) Gives the value t for which Pr(T>t) equals p, for a t-distributed variable T with n degrees of freedom display Ftail(n1,n2,f) Gives Pr(F>f) , for an F-distributed variable F with n1 and n2 degrees of freedom display invFtail(n1,n2,p) Gives the value f for which Pr(F>f) equals p, for an F-distributed variable F with n1 and n2 degrees of freedom FINDIT [command] Searches help and online databases for information on the command or statement. HELP [command] Provides help on a specific command. SEARCH [terms] Searches help text for the specified terms.
