Table 2: Estimated and unadjusted effects of exposure variables on
advertisement
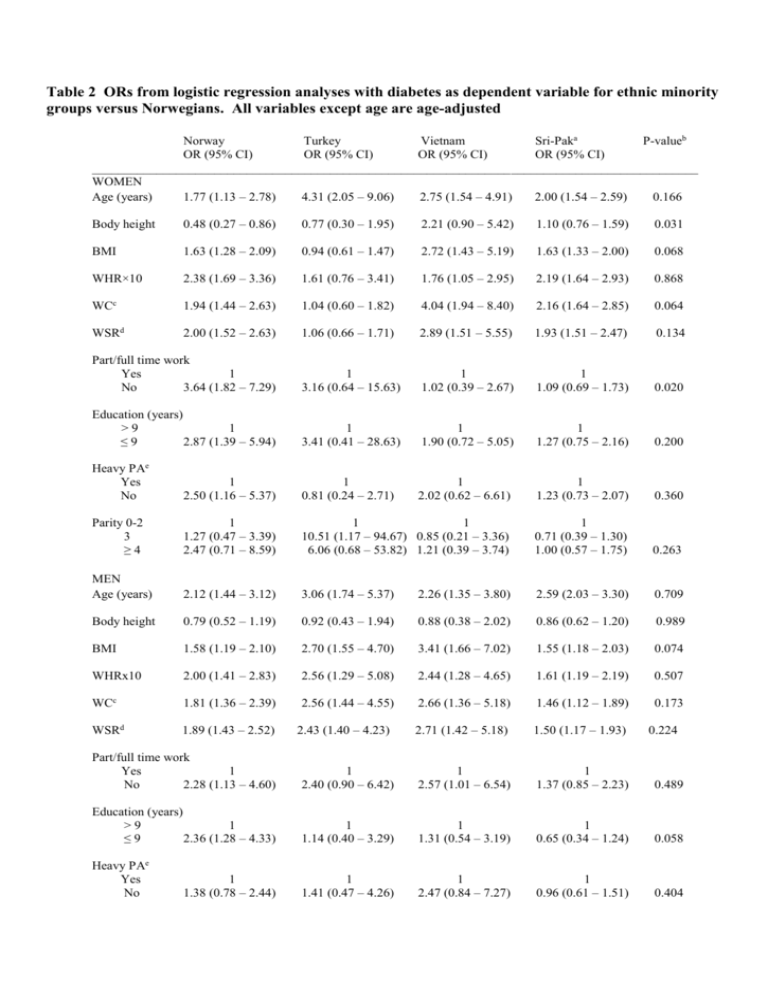
Table 2 ORs from logistic regression analyses with diabetes as dependent variable for ethnic minority groups versus Norwegians. All variables except age are age-adjusted Norway Turkey Vietnam Sri-Paka P-valueb OR (95% CI) OR (95% CI) OR (95% CI) OR (95% CI) ______________________________________________________________________________________________ WOMEN Age (years) 1.77 (1.13 – 2.78) 4.31 (2.05 – 9.06) 2.75 (1.54 – 4.91) 2.00 (1.54 – 2.59) 0.166 Body height 0.48 (0.27 – 0.86) 0.77 (0.30 – 1.95) 2.21 (0.90 – 5.42) 1.10 (0.76 – 1.59) 0.031 BMI 1.63 (1.28 – 2.09) 0.94 (0.61 – 1.47) 2.72 (1.43 – 5.19) 1.63 (1.33 – 2.00) 0.068 WHR×10 2.38 (1.69 – 3.36) 1.61 (0.76 – 3.41) 1.76 (1.05 – 2.95) 2.19 (1.64 – 2.93) 0.868 WCc 1.94 (1.44 – 2.63) 1.04 (0.60 – 1.82) 4.04 (1.94 – 8.40) 2.16 (1.64 – 2.85) 0.064 WSRd 2.00 (1.52 – 2.63) 1.06 (0.66 – 1.71) 2.89 (1.51 – 5.55) 1.93 (1.51 – 2.47) 0.134 Part/full time work Yes 1 No 3.64 (1.82 – 7.29) 1 3.16 (0.64 – 15.63) 1 1.02 (0.39 – 2.67) 1 1.09 (0.69 – 1.73) 0.020 Education (years) >9 1 ≤9 2.87 (1.39 – 5.94) 1 3.41 (0.41 – 28.63) 1 1.90 (0.72 – 5.05) 1 1.27 (0.75 – 2.16) 0.200 Heavy PAe Yes No 1 2.50 (1.16 – 5.37) 1 0.81 (0.24 – 2.71) 1 2.02 (0.62 – 6.61) 1 1.23 (0.73 – 2.07) 0.360 Parity 0-2 3 ≥4 1 1.27 (0.47 – 3.39) 2.47 (0.71 – 8.59) 1 1 10.51 (1.17 – 94.67) 0.85 (0.21 – 3.36) 6.06 (0.68 – 53.82) 1.21 (0.39 – 3.74) 1 0.71 (0.39 – 1.30) 1.00 (0.57 – 1.75) 0.263 MEN Age (years) 2.12 (1.44 – 3.12) 3.06 (1.74 – 5.37) 2.26 (1.35 – 3.80) 2.59 (2.03 – 3.30) 0.709 Body height 0.79 (0.52 – 1.19) 0.92 (0.43 – 1.94) 0.88 (0.38 – 2.02) 0.86 (0.62 – 1.20) 0.989 BMI 1.58 (1.19 – 2.10) 2.70 (1.55 – 4.70) 3.41 (1.66 – 7.02) 1.55 (1.18 – 2.03) 0.074 WHRx10 2.00 (1.41 – 2.83) 2.56 (1.29 – 5.08) 2.44 (1.28 – 4.65) 1.61 (1.19 – 2.19) 0.507 WCc 1.81 (1.36 – 2.39) 2.56 (1.44 – 4.55) 2.66 (1.36 – 5.18) 1.46 (1.12 – 1.89) 0.173 WSRd 1.89 (1.43 – 2.52) 2.71 (1.42 – 5.18) 1.50 (1.17 – 1.93) 2.43 (1.40 – 4.23) 0.224 Part/full time work Yes 1 No 2.28 (1.13 – 4.60) 1 2.40 (0.90 – 6.42) 1 2.57 (1.01 – 6.54) 1 1.37 (0.85 – 2.23) 0.489 Education (years) >9 1 ≤9 2.36 (1.28 – 4.33) 1 1.14 (0.40 – 3.29) 1 1.31 (0.54 – 3.19) 1 0.65 (0.34 – 1.24) 0.058 Heavy PAe Yes No 1 1.41 (0.47 – 4.26) 1 2.47 (0.84 – 7.27) 1 0.96 (0.61 – 1.51) 0.404 1 1.38 (0.78 – 2.44) __________________________________________________________________________________________________ OR per SD for continuous variables (age, body height, BMI, WHR×10, WC c, WSRd) and for comparing categorical variables with reference category. a Sri Lankans and Pakistanis were merged to one group. b test of interaction between ethnicity and risk factors on diabetes prevalence c WC: Waist circumference d WSR: Waist-stature (body height)-ratio e Heavy Physical Activity (≥1 hour per week versus no)
