Table 3. Proportion of patients (%) with obesity
advertisement
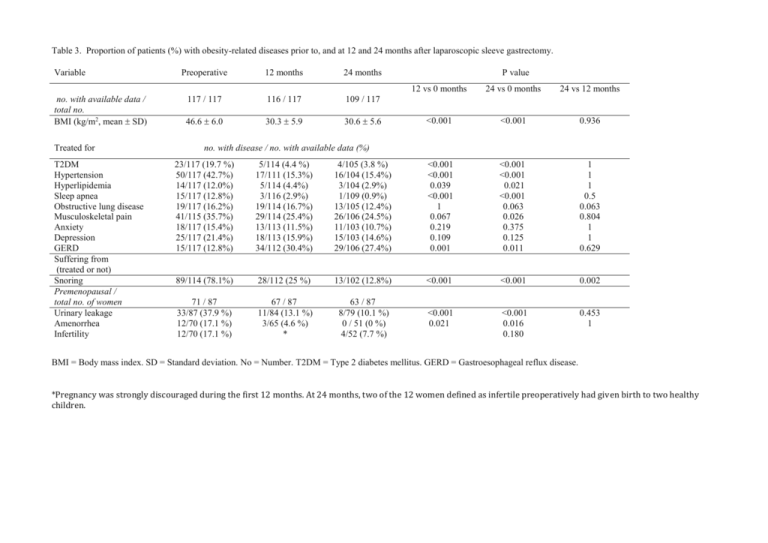
Table 3. Proportion of patients (%) with obesity-related diseases prior to, and at 12 and 24 months after laparoscopic sleeve gastrectomy. Variable no. with available data / total no. BMI (kg/m2, mean SD) Treated for T2DM Hypertension Hyperlipidemia Sleep apnea Obstructive lung disease Musculoskeletal pain Anxiety Depression GERD Suffering from (treated or not) Snoring Premenopausal / total no. of women Urinary leakage Amenorrhea Infertility Preoperative 12 months 24 months 117 / 117 116 / 117 109 / 117 46.6 6.0 30.3 5.9 30.6 5.6 P value 12 vs 0 months 24 vs 0 months 24 vs 12 months <0.001 <0.001 0.936 no. with disease / no. with available data (%) 23/117 (19.7 %) 50/117 (42.7%) 14/117 (12.0%) 15/117 (12.8%) 19/117 (16.2%) 41/115 (35.7%) 18/117 (15.4%) 25/117 (21.4%) 15/117 (12.8%) 5/114 (4.4 %) 17/111 (15.3%) 5/114 (4.4%) 3/116 (2.9%) 19/114 (16.7%) 29/114 (25.4%) 13/113 (11.5%) 18/113 (15.9%) 34/112 (30.4%) 4/105 (3.8 %) 16/104 (15.4%) 3/104 (2.9%) 1/109 (0.9%) 13/105 (12.4%) 26/106 (24.5%) 11/103 (10.7%) 15/103 (14.6%) 29/106 (27.4%) <0.001 <0.001 0.039 <0.001 1 0.067 0.219 0.109 0.001 <0.001 <0.001 0.021 <0.001 0.063 0.026 0.375 0.125 0.011 1 1 1 0.5 0.063 0.804 1 1 0.629 89/114 (78.1%) 28/112 (25 %) 13/102 (12.8%) <0.001 <0.001 0.002 71 / 87 33/87 (37.9 %) 12/70 (17.1 %) 12/70 (17.1 %) 67 / 87 11/84 (13.1 %) 3/65 (4.6 %) * 63 / 87 8/79 (10.1 %) 0 / 51 (0 %) 4/52 (7.7 %) <0.001 0.021 <0.001 0.016 0.180 0.453 1 BMI = Body mass index. SD = Standard deviation. No = Number. T2DM = Type 2 diabetes mellitus. GERD = Gastroesophageal reflux disease. *Pregnancy was strongly discouraged during the first 12 months. At 24 months, two of the 12 women defined as infertile preoperatively had given birth to two healthy children.
