Worksheet 5: Hypothesis Testing for Single Sample Means
advertisement
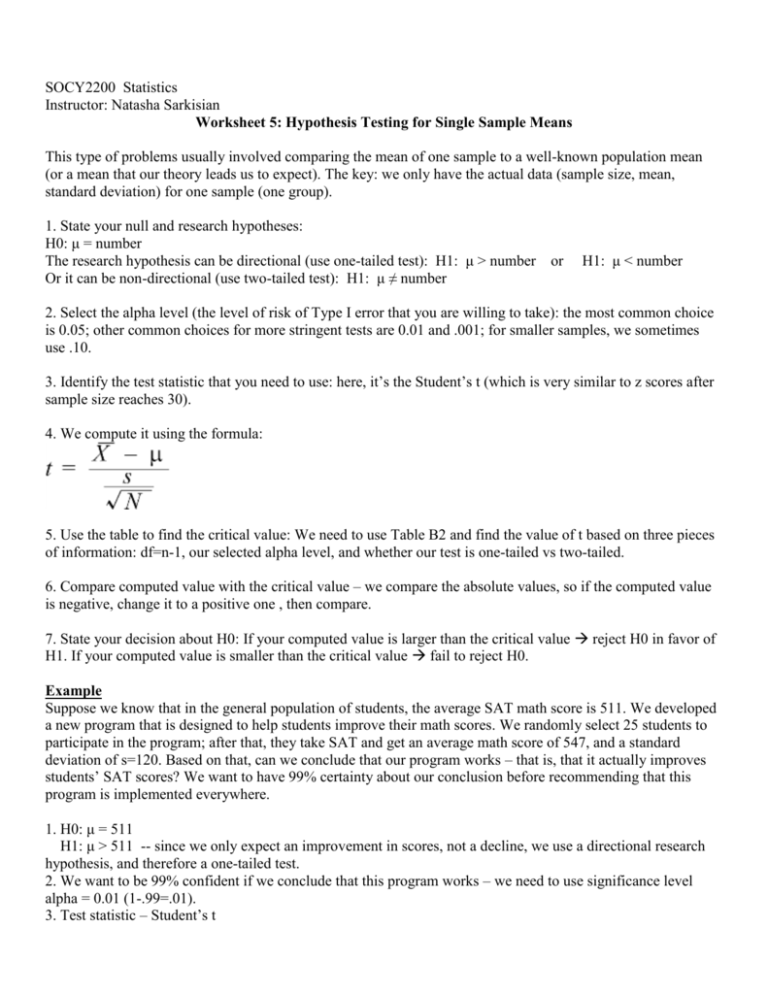
SOCY2200 Statistics Instructor: Natasha Sarkisian Worksheet 5: Hypothesis Testing for Single Sample Means This type of problems usually involved comparing the mean of one sample to a well-known population mean (or a mean that our theory leads us to expect). The key: we only have the actual data (sample size, mean, standard deviation) for one sample (one group). 1. State your null and research hypotheses: H0: μ = number The research hypothesis can be directional (use one-tailed test): H1: μ > number or Or it can be non-directional (use two-tailed test): H1: μ ≠ number H1: μ < number 2. Select the alpha level (the level of risk of Type I error that you are willing to take): the most common choice is 0.05; other common choices for more stringent tests are 0.01 and .001; for smaller samples, we sometimes use .10. 3. Identify the test statistic that you need to use: here, it’s the Student’s t (which is very similar to z scores after sample size reaches 30). 4. We compute it using the formula: 5. Use the table to find the critical value: We need to use Table B2 and find the value of t based on three pieces of information: df=n-1, our selected alpha level, and whether our test is one-tailed vs two-tailed. 6. Compare computed value with the critical value – we compare the absolute values, so if the computed value is negative, change it to a positive one , then compare. 7. State your decision about H0: If your computed value is larger than the critical value reject H0 in favor of H1. If your computed value is smaller than the critical value fail to reject H0. Example Suppose we know that in the general population of students, the average SAT math score is 511. We developed a new program that is designed to help students improve their math scores. We randomly select 25 students to participate in the program; after that, they take SAT and get an average math score of 547, and a standard deviation of s=120. Based on that, can we conclude that our program works – that is, that it actually improves students’ SAT scores? We want to have 99% certainty about our conclusion before recommending that this program is implemented everywhere. 1. H0: μ = 511 H1: μ > 511 -- since we only expect an improvement in scores, not a decline, we use a directional research hypothesis, and therefore a one-tailed test. 2. We want to be 99% confident if we conclude that this program works – we need to use significance level alpha = 0.01 (1-.99=.01). 3. Test statistic – Student’s t 4. Compute using the formula: t = (547 – 511)/ (120/sqrt(25)) = 36/(120/5) = 1.5 5. Use Table B2 to find the critical value: df=n-1=25-1=24, alpha=0.01, one-tailed test. We find tcrit = 2.492. 6. Does the computed statistic exceed the critical value? 1.5 < 2.492 so it does not exceed the critical value. 7. Conclusion: We cannot reject the null hypothesis H0: μ = 511. That means, these 25 students most likely differ from the general population of SAT takers only by chance, not because of our program. Our program probably doesn’t work. Exercise 1. Suppose, we had 100 participants in the program and obtained the same results: an average math score of 547, and a standard deviation of s=120. Let’s test the hypothesis again! Exercise 2. We know that when taking a commonly used pain medication, patients usually report that their pain is reduced by an average of 3.5 points on the pain scale. We are testing a new pain medication in a sample of 22 patients. We don’t know whether this new medication would work better or worse, but in this sample, we find an average pain reduction of 4.2 points, with a standard deviation of 1.3 points. Is the new drug a better painkiller than the old one? We want to be 95% confident in our conclusion.


