ch9_t-test
advertisement
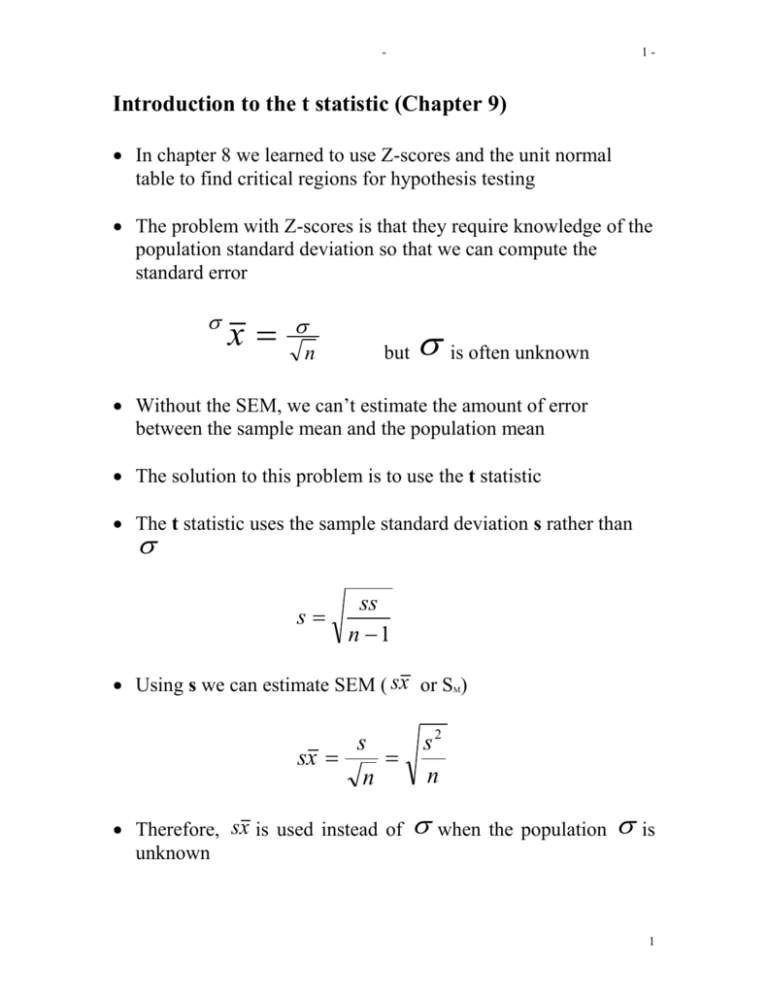
- 1- Introduction to the t statistic (Chapter 9) In chapter 8 we learned to use Z-scores and the unit normal table to find critical regions for hypothesis testing The problem with Z-scores is that they require knowledge of the population standard deviation so that we can compute the standard error x n but is often unknown Without the SEM, we can’t estimate the amount of error between the sample mean and the population mean The solution to this problem is to use the t statistic The t statistic uses the sample standard deviation s rather than s ss n 1 Using s we can estimate SEM ( sx or SM) s sx n Therefore, sx is used instead of unknown s2 n when the population is 1 - Instead of using a t statistic Z t 2- x x we can compute x sx sample mean – population mean / estimate of error Note: when you do have , always use Z-score rather than t Recall that df represents the number of scores in a sample that are free to vary and that this is always n-1 for a sample because knowing the sample mean places a restriction on the value of 1 score in the sample Also Just as the sample size influences the SEM, (larger n, the less error), the greater the df for a sample, the better the sample represents and the better the t statistic approximates the Zscore (population) T distribution: Table 9.1 note: df, 1-tail, 2-tail Full t table in Appendix B-2 p 225 para 2 - when between df in table use larger t value (smaller df) 2 - 3- Hypothesis testing: Same steps for hypothesis testing as outlined in Ch 8.(remember step 5) If the t statistic falls in the critical region (exceeds the critical value of t) then reject Ho – if not, retain Ho Example 9.1 p 227 In the literature (step 5) There is a tendency for the birds to avoid the eye spots and spend more time in the plain side of the box t(8)=6.0, p<0.05 Don’t worry about Cohen’s d on the next test or about r2 Non-directional and directional hypothesis testing with the t statistic: Same issues as for the Z stat Assumptions of t test: 1) Sample values are independent (orthogonal) usually met by random sampling 2) Sample must be normal but violation is usually not a problem especially if sample is large 30 Versatility of t test: 1) not needed from population 3 - 2) 4- often not required, depending upon question – for example with animal eye example, can be worked out logically 4


