Hypothesis Testing
advertisement
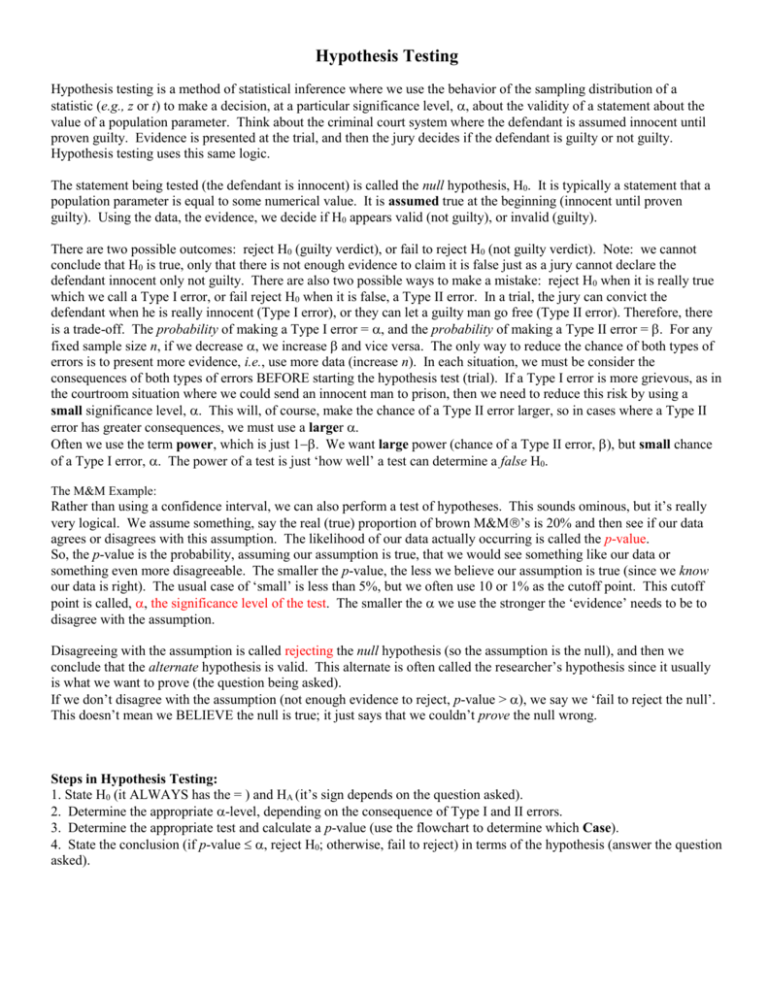
Hypothesis Testing Hypothesis testing is a method of statistical inference where we use the behavior of the sampling distribution of a statistic (e.g., z or t) to make a decision, at a particular significance level, , about the validity of a statement about the value of a population parameter. Think about the criminal court system where the defendant is assumed innocent until proven guilty. Evidence is presented at the trial, and then the jury decides if the defendant is guilty or not guilty. Hypothesis testing uses this same logic. The statement being tested (the defendant is innocent) is called the null hypothesis, H0. It is typically a statement that a population parameter is equal to some numerical value. It is assumed true at the beginning (innocent until proven guilty). Using the data, the evidence, we decide if H0 appears valid (not guilty), or invalid (guilty). There are two possible outcomes: reject H0 (guilty verdict), or fail to reject H0 (not guilty verdict). Note: we cannot conclude that H0 is true, only that there is not enough evidence to claim it is false just as a jury cannot declare the defendant innocent only not guilty. There are also two possible ways to make a mistake: reject H0 when it is really true which we call a Type I error, or fail reject H0 when it is false, a Type II error. In a trial, the jury can convict the defendant when he is really innocent (Type I error), or they can let a guilty man go free (Type II error). Therefore, there is a trade-off. The probability of making a Type I error = , and the probability of making a Type II error = . For any fixed sample size n, if we decrease , we increase and vice versa. The only way to reduce the chance of both types of errors is to present more evidence, i.e., use more data (increase n). In each situation, we must be consider the consequences of both types of errors BEFORE starting the hypothesis test (trial). If a Type I error is more grievous, as in the courtroom situation where we could send an innocent man to prison, then we need to reduce this risk by using a small significance level, . This will, of course, make the chance of a Type II error larger, so in cases where a Type II error has greater consequences, we must use a larger . Often we use the term power, which is just 1. We want large power (chance of a Type II error, ), but small chance of a Type I error, . The power of a test is just ‘how well’ a test can determine a false H0. The M&M Example: Rather than using a confidence interval, we can also perform a test of hypotheses. This sounds ominous, but it’s really very logical. We assume something, say the real (true) proportion of brown M&M’s is 20% and then see if our data agrees or disagrees with this assumption. The likelihood of our data actually occurring is called the p-value. So, the p-value is the probability, assuming our assumption is true, that we would see something like our data or something even more disagreeable. The smaller the p-value, the less we believe our assumption is true (since we know our data is right). The usual case of ‘small’ is less than 5%, but we often use 10 or 1% as the cutoff point. This cutoff point is called, , the significance level of the test. The smaller the we use the stronger the ‘evidence’ needs to be to disagree with the assumption. Disagreeing with the assumption is called rejecting the null hypothesis (so the assumption is the null), and then we conclude that the alternate hypothesis is valid. This alternate is often called the researcher’s hypothesis since it usually is what we want to prove (the question being asked). If we don’t disagree with the assumption (not enough evidence to reject, p-value > ), we say we ‘fail to reject the null’. This doesn’t mean we BELIEVE the null is true; it just says that we couldn’t prove the null wrong. Steps in Hypothesis Testing: 1. State H0 (it ALWAYS has the = ) and HA (it’s sign depends on the question asked). 2. Determine the appropriate -level, depending on the consequence of Type I and II errors. 3. Determine the appropriate test and calculate a p-value (use the flowchart to determine which Case). 4. State the conclusion (if p-value , reject H0; otherwise, fail to reject) in terms of the hypothesis (answer the question asked).
