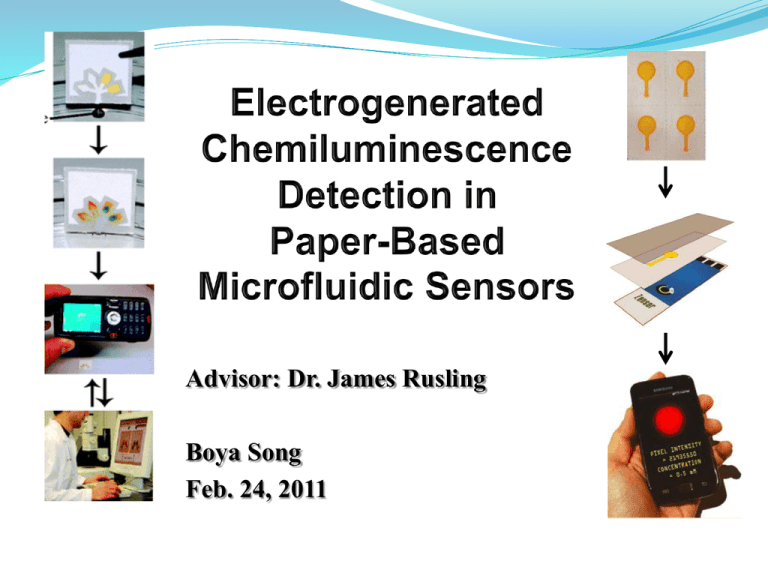
Advisor: Dr. James Rusling
Boya Song
Feb. 24, 2011
Outline
What is Microfluidic sensor ?
Why paper-based ?
How to make the Microfluidic sensor ?
How does the Microfluidic sensor work ?
How to combine the ECL with Microfluidic sensor ?
Microfluidic Sensor
(mPAD)
What is microfluidics? “It is the science and technology of systems that process
or manipulate small (10-9 to 10-18 litres) amounts of fluids, using channels with
dimensions of tens to hundreds of micrometres.” [1]
Micro
small volumes (nl, pl, fl)
small size
low energy consumption
effects of the micro domain
Microfluidic devices :
Very small quantities of sample,
Limit reagent use,
High resolution and sensitivity,
Low cost,
Short times.
[1] Whitesides, M.G. Nature. 2006, 442, 27.
Why paper-based
Ubiquitous, inexpensive.
Easy to store, transport, and manipulate.
Has minimal weight per accessible surface area.
Paper wicks fluids well; this wicking eliminates the
need for external sources of power to pump fluids
through a device. (Capillary action)
Paper can filter particulates (solids, gels, cells) from a
contaminated sample.
Can be readily disposed of safely via incineration.
(Environment friendly)
How to make the Microfluidic Sensors
Wet the paper (cellulose) in a kind of
hydrophobic polymer solution
(SU-8 2010 dissolved in cyclopentanone )
1st bake: to remove to the solvent
cyclopentanone
Irradiated it with UV through the
mask (inkjet printer +
transparencies)
2ed bake: cross linking
polymerization
Wash out the unexposed resist by
soaking in the PGMEA (propylene
glycol monomethyl ether acetate )
hydrophobic
Martinez, A W, et al. Anal. Chem. 2008, 80, 3699-3707.
How to design the Microfluidic Sensors
Glucose
assay
reagents
Protein
assay
reagents
Color: from
colorless to
brown
(I− to I2)
Color: from
yellow to blue
(NPB of TBPB
to proteins. )
Martinez, A W, et al. Anal. Chem. 2008, 80, 3699-3707.
How the Microfluidic Sensor Work
Glucose
BSA (bovine serum albumin, a model
protein for human albumin in urine)
Detection Method
LOD: 0.5 mM
LOD: 4 mM
Figure 1. Analytical calibration plots for different concentrations of glucose and
protein in artificial urine. The mean intensity for each data point was obtained
from the histogram in AdobePhotoshop. Clinical practice.
Table 1. Use the calibration curves to quantify the levels of BSA and glucose in
test samples of artificial urine; we were able to accurately measure 2.5, 3.5, and 4.5
mM glucose and 25, 35, and 45 μM BSA.
The results suggest that camera phones are nearly as effective as scanners for
acquiring quantitative data.
2008
2011
ECL-based sensing using Paper-Based
Microfluidic Sensors
Electrogenerated Chemiluminescence (ECL)
A chemiluminescence reaction initiated and controlled by the
application of an electrochemical potential.
ECL reagent:
Tris(2,2’-bipyridyl)ruthenium(II), (Ru(bpy)32+)
Good stability and ECL efficiency in aqueous media,
Favorable electrochemical properties,
Compatibility with a wide range of analytes.
Setup of the Sensor
Patterns were printed onto
A4-size filter paper with an
alkenyl ketene dimer (AKD)heptane solution using a
digital inkjet printer.
Then heated it.
The
printed
area
is
hydrophobic, whereas the
unprinted channel is still
wettable, allowing fluids to
wick.
Screen-printed Electrodes (SPEs)
Screen-printed Carbon Electrodes
http://www.dropsens.com/en/screen_printed_electrodes_pag.html
The electrochemical response of (Ru(bpy)32+) in paper
Figure 2. Cyclic voltammetry of paper soaked in 5 mM Ru(bpy)32+/pH 7.5 0.1 M
phosphate buffer in contact with a screen-printed electrode at scan rates of 0.05, 0.2,
0.5, and 1.0 V s−1 (a). Dependence of peak current on the square root of the scan rate
(b). The blue markers indicate the results for the free solution without paper, and the
open circles represent the relationship in the presence of paper. The blue line
represents the linear regression line between ip,ox and (ν)1/2 for the filled circles only.
ECL in Paper Microfluidics
The response was tested using solutions of two well-known
ECL coreactants: 2-(dibutylamino)ethanol (DBAE) and NADH.
Bard, J.A. Electrogenerated chemiluminescence.; Marcel Dekker:
New York, 2006; pp 247.
The ECL response of the sensor
Figure 4. Calibration curves for DBAE between 3 μM and 10 mM (a) and NADH
between 0.2 mM and 20 mM (b) using the paper microfluidic ECL sensors. The
straight line depicts the linear range in both. The conditions and experimental
parameters were the same as in Figure 3.
PMT: photomultiplier tube, a custom-built light-tight Faraday cage with a high voltage
power supply biased at 500 V.
Mobile Phone Detector
Simple; cheap; commonplace and portable.
Use the Samsung
I8910 HD icon mobile phone as the
photodetector.
Set to “FIREWORK” setting
(Use longer exposure time to photograph bright objections against a dark
background)
The pictures were analyzed using a program written in Python, which
output the numerical total values of pixels intensities. it could be run on
a PC or on the mobile phone itself.
Ambient light:
“In the daylight, they used the Perspex clamp completely blackened except
for a small disk opposite the working electrode, which was left transparent.
Thus, when the clamp was held against the camera aperture, all external light
was blocked.”
ECL Detection Using a Camera Phone
Figure 5. (a) Calibration curve between 0.5 mM and 20 mM for DBAE using paper
microfluidic ECL sensor with mobile camera phone as the detector. The magnitude
of the ECL signal is proportional to the intensity of the red pixels in the digital
image. (b) Digital photographic images of ECL emission from the paper fluidic
sensor obtained for various concentrations of DBAE using a camera phone. The
ECL was initiated in each case by stepping the potential of the sensor from 0 to 1.25
V following application of a drop of sample.
Future work
A lower detection limit is almost certainly achievable with further
optimization of chemistry and camera parameters.
The settings on the phone do not allow direct manipulation of the exposure
time. The ability to do so would undoubtedly enhance sensitivity because
the ECL emission can be sustained for several seconds.
Market prospect.
References
[1] Whitesides, M.G. The origins and the future of microfluidics. Nature. 2006,
442, 27.
[2] Martinez, A W, et al. Simple telemedicine for developing regions: Camera
phones and paper-based microfluidic devices for real-time, off-site
diagnosis. Anal. Chem. 2008, 80, 3699-3707.
[3] Delaney, L.J.; Hogan, F.C.,; Tian, J.; Shen, W. Electrogenerated
Chemiluminescence Detection in Paper-Based Microfluidic Sensors. Anal.
Chem. 2011, 83, 1300–1306.
[4] Bard, J.A. Electrogenerated chemiluminescence.; Marcel Dekker: New
York, 2006; pp 247.

