Results PostNL Q3 2014
advertisement
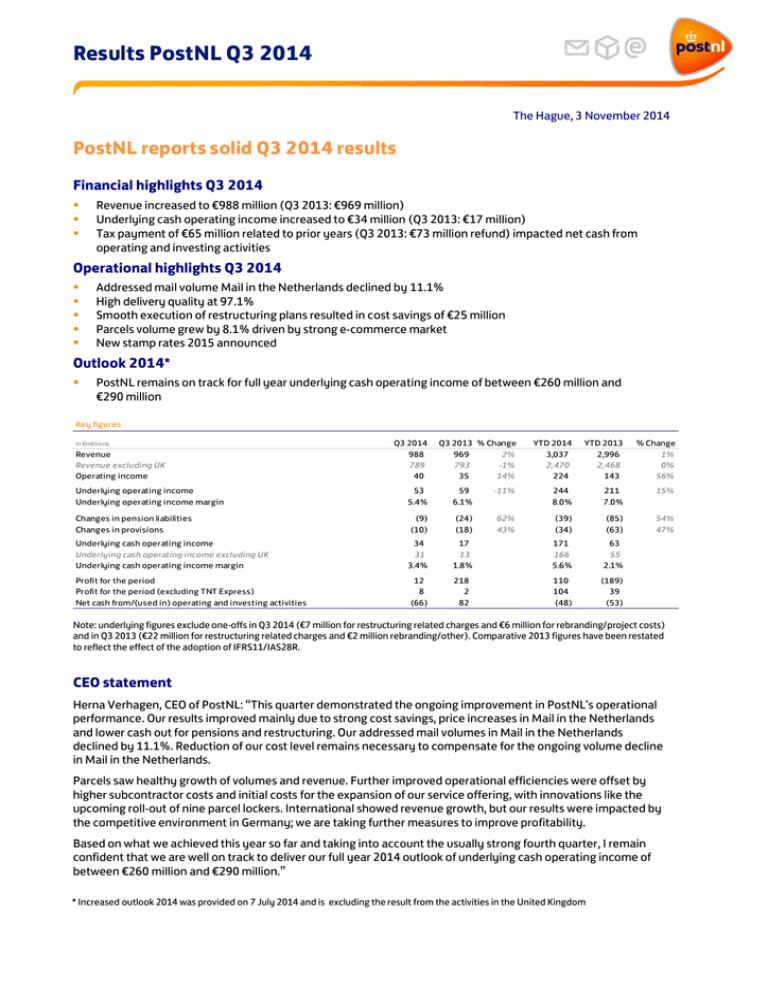
Results PostNL Q3 2014 The Hague, 3 November 2014 PostNL reports solid Q3 2014 results Financial highlights Q3 2014 Revenue increased to €988 million (Q3 2013: €969 million) Underlying cash operating income increased to €34 million (Q3 2013: €17 million) Tax payment of €65 million related to prior years (Q3 2013: €73 million refund) impacted net cash from operating and investing activities Operational highlights Q3 2014 Addressed mail volume Mail in the Netherlands declined by 11.1% High delivery quality at 97.1% Smooth execution of restructuring plans resulted in cost savings of €25 million Parcels volume grew by 8.1% driven by strong e-commerce market New stamp rates 2015 announced Outlook 2014* PostNL remains on track for full year underlying cash operating income of between €260 million and €290 million Key figures in €millions Revenue Revenue excluding UK Operating income Q3 2014 988 789 40 Q3 2013 % Change 969 2% 793 -1% 35 14% YTD 2014 3,037 2,470 224 YTD 2013 2,996 2,468 143 % Change 1% 0% 56% Underlying operating income Underlying operating income margin 53 5.4% 59 6.1% -11% 244 8.0% 211 7.0% 15% Changes in pension liabilities Changes in provisions (9) (10) (24) (18) 62% 43% (39) (34) (85) (63) 54% 47% Underlying cash operating income Underlying cash operating income excluding UK Underlying cash operating income margin 34 31 3.4% 17 13 1.8% 94% 138% 171 166 5.6% 63 55 2.1% 168% 197% Profit for the period Profit for the period (excluding TNT Express) Net cash from/(used in) operating and investing activities 12 8 (66) 218 2 82 -94% 279% -180% 110 104 (48) (189) 39 (53) 158% 167% 9% Note: underlying figures exclude one-offs in Q3 2014 (€7 million for restructuring related charges and €6 million for rebranding/project costs) and in Q3 2013 (€22 million for restructuring related charges and €2 million rebranding/other). Comparative 2013 figures have been restated to reflect the effect of the adoption of IFRS11/IAS28R. CEO statement Herna Verhagen, CEO of PostNL: “This quarter demonstrated the ongoing improvement in PostNL's operational performance. Our results improved mainly due to strong cost savings, price increases in Mail in the Netherlands and lower cash out for pensions and restructuring. Our addressed mail volumes in Mail in the Netherlands declined by 11.1%. Reduction of our cost level remains necessary to compensate for the ongoing volume decline in Mail in the Netherlands. Parcels saw healthy growth of volumes and revenue. Further improved operational efficiencies were offset by higher subcontractor costs and initial costs for the expansion of our service offering, with innovations like the upcoming roll-out of nine parcel lockers. International showed revenue growth, but our results were impacted by the competitive environment in Germany; we are taking further measures to improve profitability. Based on what we achieved this year so far and taking into account the usually strong fourth quarter, I remain confident that we are well on track to deliver our full year 2014 outlook of underlying cash operating income of between €260 million and €290 million.” * Increased outlook 2014 was provided on 7 July 2014 and is excluding the result from the activities in the United Kingdom Q3 2014 Results PostNL | Page 2 Update Sustainable delivery 2015 Subject Operations Mail in NL Smooth execution of restructuring plans CLA Towards sustainable labour costs Cost savings To compensate for volume decline Underpinning cost savings and price increases Regulatory developments Q3 2014 Good progress migration and optimisation depots while keeping quality high at 97.1% Installation first new sorting machine Improvements car unit implemented in first region, preparation for other regions started New and balanced CLA mail deliverers Negotiations CLA PostNL started, with focus on adjustments pensions with regard to the new pension regulation €25 million of which €21 million in Mail in the Netherlands Tariff increase Mail in the Netherlands as per 1 January 2015 Postal regulation – final decision ACM on tariff headroom expected in November Postal Act – sent to Parliament Consultation paper Significant Market Power expected to be published by ACM before year end Main developments PostNL and segments in €million Mail in NL Parcels International PostNL Other Intercompany PostNL Underlying operating inc ome Revenue 0 Q3 2014 442 204 420 55 (133) 988 Q3 2013 % Change 463 192 390 64 (140) 969 - 5% 6% 8% - 11% 4% 2% Q3 2014 36 18 1 (2) 53 Underlying c ash operating inc ome Q3 2013 % Change 25 21 5 8 59 42% - 13% - 78% - 133% - 11% Q3 2014 22 19 1 (8) 34 Q3 2013 % Change (1) 20 6 (8) 17 2736% - 9% - 85% 3% 94% Not e: underlying f igures exclude one-of f s PostNL’s reported revenue in Q3 was €988 million, up 2% compared to the prior year. Adjusted for the currency effect, revenue was flat. Underlying cash operating income increased to €34 million (Q3 2013: €17 million) explained by lower pension cash out and lower cash out from provisions. Underlying operating income decreased by €6 million. This decrease is explained by cost savings of €17 million (excluding pensions) and lower implementation costs (€5 million), which were more than offset by autonomous cost increases of €7 million, the result in Parcels (€(3) million) and International (€(4) million) and other effects (€(14) million). Part of these other effects is the result of phasing of revenue to next quarter, without this phasing effect underlying operating income would have been flat compared to last year. Addressed mail volume in Mail in the Netherlands declined by 11.1% in the quarter (underlying volume decline 10.9%). Revenue declined by 5% to €442 million. Underlying cash operating income improved to €22 million. The total effect of volume decline, change in mix and price increases was flat in Q3. Cost savings, lower implementation costs and lower cash out for pensions and provisions more than compensated for autonomous cost increases and other effects. Parcels’ volume in the quarter increased by 8.1%, mainly as a result of the continued growth of the e-commerce market. Revenue increased by 6% to €204 million. Better business performance was offset by higher subcontractor costs and initial costs for the expansion of our service offering. The resulting underlying cash operating income was €19 million (Q3 2013: €20 million). Q3 2014 Results PostNL | Page 3 International revenue increased by 8% to €420 million. Adjusted for the currency effect, revenue was up 4%. Underlying cash operating income was €1 million (Q3 2013: €6 million). The decline is mainly explained by the competitive environment in the German consolidation business. In the United Kingdom, revenue was €200 million (Q3 2013: €179 million). Adjusted for the currency effect, revenue increased by 4%. Revenue growth was driven by higher prices and a more favourable product mix. Ofcom is currently expected to publish its consultation document about the regulatory framework before the end of the year. In September our activities in the United Kingdom were rebranded to Whistl. In Germany, revenue decreased by 2% to €119 million (Q3 2013: €122 million). The consolidation business continued to be impacted by the fierce competitive situation, resulting both in lower volumes and lower prices. We are still awaiting rulings from Bundeskartellamt and Bundesnetzagentur, required to foster a competitionfriendly market environment. The revenue decline in the consolidation business was partly compensated by new business wins and growing volumes in the other business lines. We have initiated actions in Germany to attract additional volumes and implemented further cost savings plans to improve profitability. In Italy, revenue increased by 2% to €54 million (Q3 2013: €53 million) driven by continued volume growth of Formula Certa (+5%). Revenue in PostNL Other decreased to €55 million (Q3 2013: €64 million), almost fully explained by lower internal revenue. Underlying cash operating income was flat at €(8) million. Equity, pensions and cash flow development Total equity attributable to equity holders of the parent decreased to €(747) million on 27 September 2014 from €(618) million as per 28 June 2014. The decrease is mainly explained by net profit for the period of €12 million more than offset by a fair value change of our stake in TNT Express of €(125) million and a negative impact from pensions of €(20) million. The coverage ratio of the main pension fund was 110.5% at the end of the third quarter. The pension expense in Q3 2014 amounted to €31 million (Q3 2013: €33 million). The cash contributions decreased to €40 million (Q3 2013: €57 million) mainly as a result of the pension arrangement effective 1 January 2014. Net cash from operating and investing activities was €(66) million in Q3 2014, €148 million less than the prior year, mainly explained by the impact of the income taxes paid / received related to prior years (€65 million payment in Q3 2014 and €73 million refund in Q3 2013 on preliminary tax assessments in the Netherlands relating to timing differences). At the end of Q3 2014, net debt was €861 million, which compares to €788 million at the end of Q2 2014. The increase is mainly explained by the expected tax payment as explained above. Q3 2014 Results PostNL | Page 4 Financial calendar 23 February 2015 Publication of Q4 & FY 2014 results 6 May 2015 Publication of Q1 2015 results 3 August 2015 Publication of Q2 & HY 2015 results 2 November 2015 Publication of Q3 2015 results Contact information Published by PostNL N.V. Prinses Beatrixlaan 23 2595 AK The Hague The Netherlands T: +31 88 86 86 161 Investor Relations Richard Piekaar Director Treasury & Investor Relations M: +31 619 26 94 99 E: richard.piekaar@postnl.nl Media Relations Dick Kors Manager Media Relations & PR T: +31 88 86 88 260 E: dick.kors@postnl.nl Inge Steenvoorden Manager Investor Relations M: +31 610 51 96 70 E: inge.steenvoorden@postnl.nl Audio webcast and conference call Q3 2014 results On 3 November 2014, at 14.00 CET, the conference call for analysts and investors will start. The conference call can be followed live via an audio webcast on www.postnl.com. Additional information Additional information is available at www.postnl.com. Warning about forward-looking statements Some statements in this press release are ’forward-looking statements‘. By their nature, forward-looking statements involve risk and uncertainty because they relate to events and depend on circumstances that may occur in the future. These forwardlooking statements involve known and unknown risks, uncertainties and other factors that are outside of our control and impossible to predict and may cause actual results to differ materially from any future results expressed or implied. These forward-looking statements are based on current expectations, estimates, forecasts, analyses and projections about the industries in which we operate and management's beliefs and assumptions about possible future events. You are cautioned not to put undue reliance on these forward-looking statements, which only speak as of the date of this press release and are neither predictions nor guarantees of possible future events or circumstances. We do not undertake any obligation to release publicly any revisions to these forward-looking statements to reflect events or circumstances after the date of this press release or to reflect the occurrence of unanticipated events, except as may be required under applicable securities laws. Consolidated interim financial statements Consolidated statement of financial position in €millions ASSETS Non-current assets Intangible assets Goodwill Other intangible assets Total Property, plant and equipment Land and buildings Plant and equipment Other Construction in progress Total Financial fixed assets Investments in joint ventures/associates Other financial fixed assets Deferred tax assets Available-for-sale financial assets Total Total non-current assets Current assets Inventory Trade accounts receivable Accounts receivable Income tax receivable Prepayments and accrued income Cash and cash equivalents Total current assets Assets classified as held for sale Total assets LIABILITIES AND EQUITY Equity Equity attributable to the equity holders of the parent Non-controlling interests Total Non-current liabilities Deferred tax liabilities Provisions for pension liabilities Other provisions Long-term debt Accrued liabilities Total Current liabilities Trade accounts payable Other provisions Other current liabilities Income tax payable Accrued current liabilities Total Liabilities related to assets classified as held for sale Total equity and liabilities 27 September 2014 Restated 31 December 2013 Restated 1 January 2013 84 43 127 84 46 130 100 56 156 353 121 29 14 517 345 127 35 29 536 303 139 39 51 532 35 8 50 398 491 1,135 36 9 51 542 638 1,304 1,403 7 70 0 1,480 2,168 5 348 44 6 120 416 939 210 2,284 5 361 29 1 104 451 951 194 2,449 6 419 57 2 116 370 970 62 3,200 (747) 6 (741) (696) 6 (690) (318) 8 (310) 37 543 111 923 1 1,615 37 542 128 1,260 1 1,968 41 532 117 1,611 2 2,303 116 61 579 16 490 1,262 148 2,284 153 69 209 54 552 1,037 134 2,449 222 83 253 26 612 1,196 11 3,200 Q3 2014 Results PostNL | Page 6 Consolidated income statement in €millions Net sales Other operating revenue Total operating revenue Other income Cost of materials Work contracted out and other external expenses Salaries, pensions and social security contributions Depreciation, amortisation and impairments Other operating expenses Total operating expenses Operating income Interest and similar income Interest and similar expenses Net financial expenses Results from investments in jv's/associates Reversal of/(impairment) of investments in associates Profit/(loss) before income taxes Income taxes Profit for the period Attributable to: Non-controlling interests Equity holders of the parent Earnings per (diluted) o rdinary share (in €cents) 1 Q3 2014 Restated Q3 2013 YTD 2014 Restated YTD 2013 985 3 988 3 (21) (542) (317) (25) (46) (951) 40 5 (26) (21) 19 (7) 12 966 3 969 1 (19) (504) (336) (32) (44) (935) 35 4 (32) (28) (2) 218 223 (5) 218 3,029 8 3,037 6 (65) (1,580) (964) (72) (138) (2,819) 224 10 (79) (69) 155 (45) 110 2,987 9 2,996 6 (65) (1,535) (1,044) (87) (128) (2,859) 143 5 (92) (87) 37 (263) (170) (19) (189) 12 (1) 219 110 (1) (188) 49.8 25.0 (42.7) 2.7 1 Based on an average of 440,478,632 out st anding ordinary shares (2013: 439,973,297). Consolidated statement of comprehensive income in €millions Profit for the period Other comprehensive income that will not be reclassified to the income statement Impact pensions, net of tax Share other comprehensive income jv's/associates Other comprehensive income that may be reclassified to the income statement Currency translation adjustment, net of tax Gains/(losses) on cashflow hedges, net of tax Share other comprehensive income jv's/associates Change in value of available-for-sale financial assets Total other comprehensive income for the period Total comprehensive income for the period Attributable to: Non-controlling interests Equity holders of the parent Q3 2014 12 Restated Q3 2013 218 YTD 2014 Restated YTD 2013 110 (189) (20) 0 19 (1) (19) 0 (156) (7) 1 2 0 (125) (142) 1 2 (5) 0 16 2 (3) 0 (144) (164) (1) (2) (16) 0 (182) (130) 234 (54) (371) (130) (1) 235 0 (54) (1) (370) Q3 2014 Results PostNL | Page 7 Consolidated statement of cash flows in €millions Profit/(loss) before income taxes Adjustments for: Depreciation, amortisation and impairments Share-based payments (Profit)/loss on assets held for sale Interest and similar income Interest and similar expenses (Reversal of) impairments and results of investments in jv's/associates Investment income Pension liabilities Other provisions Changes in provisions Inventory Trade accounts receivable Other accounts receivable Other current assets Trade accounts payable Other current liabilities excluding short-term financing and taxes Changes in working capital Cash generated from operations Interest paid Income taxes received/(paid) Net cash (used in)/from operating activities Q3 2014 Restated Q3 2013 YTD 2014 Restated YTD 2013 19 223 155 (170) 25 1 (1) (5) 26 20 (9) (4) (13) 1 (24) (13) 17 (35) 51 (3) 49 (45) (65) (61) 32 3 (1) (4) 32 (216) (189) (24) 4 (20) 1 (12) (1) (17) 45 16 65 (42) 73 96 72 3 (4) (10) 79 65 (39) (25) (64) (11) (4) (16) (34) (30) (95) 136 (60) (79) (3) 87 3 (5) (5) 92 226 308 (148) 5 (143) 6 8 (19) (41) (39) (85) 0 (59) 63 4 1 4 (6) (8) 4 (5) 4 3 (5) (16) (14) 2 6 (18) (45) 10 (45) 5 8 (13) (66) 9 (57) - - Interest received Dividends received Capital expenditure on intangible assets Capital expenditure on property, plant and equipment Proceeds from sale of property, plant and equipment Net cash (used in)/from investing activities Changes related to non-controlling interests Proceeds from short term borrowings Repayments of short term borrowings Repayments of finance leases Net cash (used in)/from financing activities - Total change in cash (63) Cash at the beginning of the period Cash included in assets held for sale Exchange rate differences Total change in cash Cash at the end of the period 487 (8) (63) 416 1 2 3 2 (8) (1) (7) (3) 3 (1) (1) (2) 80 (55) (55) 234 80 314 451 20 (55) 416 370 (1) (55) 314 (2) (2) Q3 2014 Results PostNL | Page 8 Basis of preparation The interim financial statements are reported on a year-to-date basis ending 27 September 2014. The information should be read in conjunction with the consolidated 2013 Annual Report of PostNL N.V. as published on 24 February 2014. Apart from the changes in accounting for joint ventures (IFRS 11/IAS 28R), all other significant accounting policies applied in these consolidated interim financial statements are consistent with those applied in PostNL’s consolidated 2013 Annual Report for the year ended 31 December 2013. The measure of profit and loss and assets and liabilities is based on the Group Accounting Policies, which are compliant with IFRS as endorsed by the European Union. Per 1 January 2014 IFRS 11 ‘Joint Arrangements’ and the revisions in IAS 28 ‘Associates and joint ventures’ have been adopted. PostNL recognised the investment in the joint ventures at the beginning of the earliest period presented (1 January 2013) as the net amount of the carrying value of the assets and liabilities previously proportionately consolidated by the group. This is the deemed cost of the group’s investment in the joint venture for applying equity accounting. PostNL’s most significant joint venture as at 31 December 2013 was the 50% interest in Postkantoren B.V. / Bruna B.V. (Mail in the Netherlands). In addition, PostNL holds a 50% interest in HIM Holtzbrinck joint ventures (International). The comparative figures of 2013 have been restated for this change. There is no impact on shareholders’ equity, comprehensive income, net result and earnings per share. Classification of stake in TNT Express In December 2013, PostNL sold part of its stake in TNT Express. In accordance with IAS 39, the remaining 14.7% stake in TNT Express is considered an available-for-sale financial asset measured at fair value with gains and losses arising from changes in the fair value recognised in other comprehensive income. Until the start of Q4 2013, the stake in TNT Express was classified as an investment in associates accounted for using the equity method. Classification of Whistl (formerly TNT Post UK) In December 2013, PostNL reached an agreement with LDC to establish a joint venture, which will allow Whistl to roll out its E2E service. At completion, PostNL will have a 40% stake in the joint venture and control will be lost. This resulted in the transfer of the assets and liabilities of Whistl to held for sale at the end of 2013. Auditor’s involvement The content of this interim financial report has not been audited or reviewed by an external auditor. Q3 2014 Results PostNL | Page 9 Summary of restatements The following tables summarise the effect of the adoption of IFRS 11 and IAS 28R on the consolidated balance sheet per 1 January 2013 and 31 December 2013 and the consolidated (comprehensive) income statement for YTD Q3 2013 and the full year 2013. Consolidated statement of financial position in €millions ASSETS Total intangibles Total property, plant and equipment Investments in associates/jv's Other financial fixed assets Total financial fixed assets Total non-current assets Total current assets Assets classified as held for sale TOTAL ASSETS Repo rted Restatements 31Dec 2012 (301) 9 (292) 2,310 1,187 11 3,216 (12) (4) 30 3 33 17 (32) (1) (16) (17) (1) (18) (7) 9 (16) Consolidated income statement Repo rted Restatements in €millions YTD 2013 EQUITY AND LIABILITIES Equity for shareholders of the parent Non-controlling interests Total equity Total non-current liabilities Total current liabilities Liabilities related to assets classified as held for sale TOTAL EQUITY AND LIABILITIES Net sales Other operating revenue Total operating revenue Other income Cost of materials Work contracted out and other external expenses Salaries, pensions and social security contributions Depreciation, amortisation and impairments Other operating expenses Total operating expenses Operating income Interest and similar income Interest and similar expenses Net financial expense Results from investments in associates/jv's Reversal of/(impairment of) investments in associates/jv's Profit/(loss) before income taxes Income taxes Profit for the year 168 536 1,373 74 1,447 2,151 1,002 63 3,216 - 3,092 9 3,101 6 (123) (1,552) (1,063) (89) (134) (2,961) 146 5 (93) (88) 36 (263) (169) (20) (189) (105) (105) 58 17 19 2 6 102 (3) 1 1 1 (1) 1 - Restated Repo rted Restatements Restated 1Jan 2013 31Dec 2013 - 31Dec 2013 156 532 1,403 77 1,480 2,168 970 62 3,200 - 143 539 6 603 609 1,291 979 194 2,464 - (318) 8 (310) 2,303 1,196 11 3,200 (679) 7 (672) 1,973 1,046 117 2,464 (13) (3) 30 (1) 29 13 (28) (15) (17) (1) (18) (5) (9) 17 (15) Restatements Restated Repo rted YTD 2013 FY 2013 2,987 9 2,996 6 (65) (1,535) (1,044) (87) (128) (2,859) 143 5 (92) (87) 37 (263) (170) (19) (189) 4,296 11 4,307 7 (167) (2,142) (1,288) (132) (181) (3,910) 404 10 (184) (174) 36 (369) (103) (67) (170) 130 536 36 602 638 1,304 951 194 2,449 (696) 6 (690) 1,968 1,037 134 2,449 Restated FY 2013 (144) (144) 79 23 28 3 7 140 (4) (1) 1 2 (2) 2 - 4,152 11 4,163 7 (88) (2,119) (1,260) (129) (174) (3,770) 400 9 (183) (174) 38 (369) (105) (65) (170) Earnings per o rdinary share (in €cents) (42.7) - (42.7) (38.6) - (38.6) Earnings per diluted o rdinary share (in €cents) (42.7) - (42.7) (38.6) - (38.6) (156) (7) (230) (5) (19) (182) (371) 24 (211) (381) Other comprehensive income that will not be reclassified to the income statement Impact pensions, net of tax Share other comprehensive income associates (158) (5) Other comprehensive income that may be reclassified to the income statement Total other comprehensive income for the period Total comprehensive income for the period (19) (182) (371) 2 (2) - 3 (3) - (227) (8) 24 (211) (381)


