Global Leading Indicator
advertisement
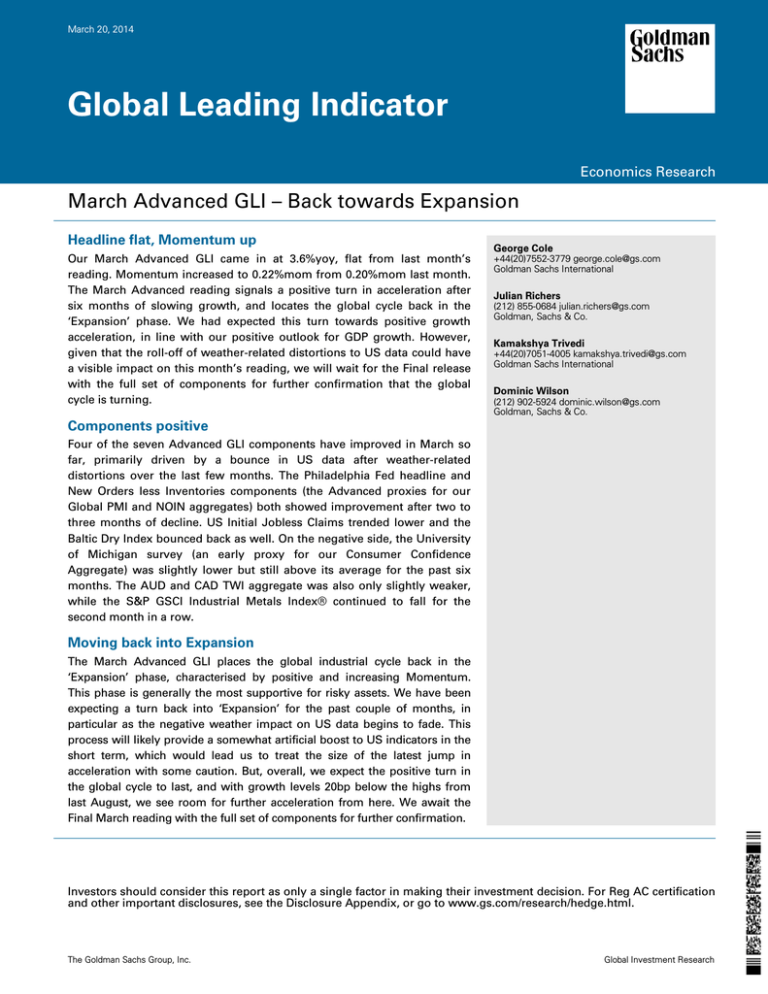
March 20, 2014 Global Leading Indicator Economics Research March Advanced GLI – Back towards Expansion Headline flat, Momentum up Our March Advanced GLI came in at 3.6%yoy, flat from last month’s reading. Momentum increased to 0.22%mom from 0.20%mom last month. The March Advanced reading signals a positive turn in acceleration after six months of slowing growth, and locates the global cycle back in the ‘Expansion’ phase. We had expected this turn towards positive growth acceleration, in line with our positive outlook for GDP growth. However, given that the roll-off of weather-related distortions to US data could have a visible impact on this month’s reading, we will wait for the Final release with the full set of components for further confirmation that the global cycle is turning. George Cole +44(20)7552-3779 george.cole@gs.com Goldman Sachs International Julian Richers (212) 855-0684 julian.richers@gs.com Goldman, Sachs & Co. Kamakshya Trivedi +44(20)7051-4005 kamakshya.trivedi@gs.com Goldman Sachs International Dominic Wilson (212) 902-5924 dominic.wilson@gs.com Goldman, Sachs & Co. Components positive Four of the seven Advanced GLI components have improved in March so far, primarily driven by a bounce in US data after weather-related distortions over the last few months. The Philadelphia Fed headline and New Orders less Inventories components (the Advanced proxies for our Global PMI and NOIN aggregates) both showed improvement after two to three months of decline. US Initial Jobless Claims trended lower and the Baltic Dry Index bounced back as well. On the negative side, the University of Michigan survey (an early proxy for our Consumer Confidence Aggregate) was slightly lower but still above its average for the past six months. The AUD and CAD TWI aggregate was also only slightly weaker, while the S&P GSCI Industrial Metals Index® continued to fall for the second month in a row. Moving back into Expansion The March Advanced GLI places the global industrial cycle back in the ‘Expansion’ phase, characterised by positive and increasing Momentum. This phase is generally the most supportive for risky assets. We have been expecting a turn back into ‘Expansion’ for the past couple of months, in particular as the negative weather impact on US data begins to fade. This process will likely provide a somewhat artificial boost to US indicators in the short term, which would lead us to treat the size of the latest jump in acceleration with some caution. But, overall, we expect the positive turn in the global cycle to last, and with growth levels 20bp below the highs from last August, we see room for further acceleration from here. We await the Final March reading with the full set of components for further confirmation. Investors should consider this report as only a single factor in making their investment decision. For Reg AC certification and other important disclosures, see the Disclosure Appendix, or go to www.gs.com/research/hedge.html. The Goldman Sachs Group, Inc. Global Investment Research March 20, 2014 Global Leading Indicator (GLI) GLI charts Headline GLI vs. Global Industrial Production* 20 % yoy GLI Momentum vs. Global Industrial Production* 1.6 15 1.2 % mom 0.8 10 0.4 0.0 5 -0.4 0 -0.8 -1.2 -5 -1.6 -10 -2.0 Global Industrial Production* GLI Headline -15 -20 98 99 00 01 02 03 04 05 06 07 08 09 10 11 12 13 14 -2.4 -2.8 -3.2 Global Industrial Production*, 3mma GLI Momentum 98 99 00 01 02 03 04 05 06 07 08 09 10 11 12 13 14 *Includes OECD countries plus BRICs, Indonesia and South Africa Source: IMF, National Sources, Goldman Sachs Global Investment Research *Includes OECD countries plus BRICs, Indonesia and South Africa Source: IMF, National Sources, Goldman Sachs Global Investment Research Monthly Change in Components* Global Leading Indicator Swirlogram 0.04% Improved Baltic Dry Index 0.03% Global New Orders Less Inventories 0.02% US Initial Jobless Claims Worsened Consumer Confidence Aggregate GS Australian and Canadian Dollar Trade Weighted Index S&P GSCI Industrial Metals Index Excluded (No New Data Until Final Reading) Belgian and Netherlands Manufacturing Survey Japan IP Inventory/Sales Ratio Korean Exports *month over month change Source: Haver Analytics, National Sources, Goldman Sachs Global Investment Research Goldman Sachs Global Investment Research GLI Acceleration Global PMI (Philadelphia Fed Survey) Recovery Expansion May-13 Jul-13 Mar-14 Jun-13 Aug-13 0.01% Apr-13 0.00% -0.01% -0.02% Sep-13 Jan-14 Oct-13 Feb-14 -0.03% -0.04% Contraction -0.05% -0.1% 0.0% Nov-13 Dec-13 0.1% 0.2% GLI Growth Slowdown 0.3% 0.4% 0.5% Source: Goldman Sachs Global Investment Research 2 March 20, 2014 Global Leading Indicator (GLI) The Global Leading Indicator (GLI) is a Goldman Sachs proprietary indicator that is meant to provide an early signal of the global industrial cycle on a monthly basis. There is an Advanced reading for each month, released mid-month, followed by the Final reading, released on the first business day of the following month. The GLI was introduced in 2002 and has been revised twice since then, in 2006 and 2010. To learn about the latest GLI revamp in further detail, please refer to Global Economics Paper No 199: ‘An Even More Global GLI (Global Leading Indicator)’. Procedure for the Construction of the GLI Individual Component Aggregation. Those components needing aggregation are first standardised. Consumer confidences, Belgian and Netherlands manufacturing surveys, and AUD and CAD TWIs are standardised to a common mean and standard deviation, and then averaged. Global* PMI and Global* New Orders Less Inventories are aggregated using GDP in purchasing power parity (PPP) weights. Filtering. To track the business cycle, we extract the underlying cyclical pattern from the 10 components and the IP reference series by filtering out long-term trends and high frequency noise. We use the OECD methodology for cycle extraction to ‘double-smooth’ the series by running a Hodrick-Prescott filter in two stages (first to remove long-term trends and second to remove high frequency noise). Cycle Construction. The 10 double-smoothed components are equally weighted, producing an aggregated cyclical series. Each component thus has a 10% weight. Amplitude Adjustment. The aggregate cyclical series is rescaled to ensure its amplitude matches the amplitude of the de-trended and smoothed IP reference series. Technically, this procedure equalises their standard deviations. Trend Restoration. We add this ‘de-trended’ GLI to the long-term trend of the IP reference series obtained from the first stage of the filtering above. Transformation. This ‘trend-restored’ version of the GLI is then comparable to the IP reference series and is used to construct our headline reading, which is a year-over-year change, and the momentum reading, which is a monthover-month change. *Includes 23 countries: Australia, Austria, Brazil, China, Czech Republic, France, Germany, Greece, India, Ireland, Italy, Japan, Netherlands, Norway, Poland, Russia, Spain, Sweden, Switzerland, Taiwan, Turkey, UK, US. Goldman Sachs Global Investment Research 3 March 20, 2014 Global Leading Indicator (GLI) Disclosure Appendix Reg AC We, George Cole, Julian Richers, Kamakshya Trivedi and Dominic Wilson, hereby certify that all of the views expressed in this report accurately reflect our personal views, which have not been influenced by considerations of the firm's business or client relationships. Disclosures Global product; distributing entities The Global Investment Research Division of Goldman Sachs produces and distributes research products for clients of Goldman Sachs on a global basis. Analysts based in Goldman Sachs offices around the world produce equity research on industries and companies, and research on macroeconomics, currencies, commodities and portfolio strategy. This research is disseminated in Australia by Goldman Sachs Australia Pty Ltd (ABN 21 006 797 897); in Brazil by Goldman Sachs do Brasil Corretora de Títulos e Valores Mobiliários S.A.; in Canada by either Goldman Sachs Canada Inc. or Goldman, Sachs & Co.; in Hong Kong by Goldman Sachs (Asia) L.L.C.; in India by Goldman Sachs (India) Securities Private Ltd.; in Japan by Goldman Sachs Japan Co., Ltd.; in the Republic of Korea by Goldman Sachs (Asia) L.L.C., Seoul Branch; in New Zealand by Goldman Sachs New Zealand Limited; in Russia by OOO Goldman Sachs; in Singapore by Goldman Sachs (Singapore) Pte. (Company Number: 198602165W); and in the United States of America by Goldman, Sachs & Co. Goldman Sachs International has approved this research in connection with its distribution in the United Kingdom and European Union. European Union: Goldman Sachs International authorised by the Prudential Regulation Authority and regulated by the Financial Conduct Authority and the Prudential Regulation Authority, has approved this research in connection with its distribution in the European Union and United Kingdom; Goldman Sachs AG and Goldman Sachs International Zweigniederlassung Frankfurt, regulated by the Bundesanstalt für Finanzdienstleistungsaufsicht, may also distribute research in Germany. General disclosures This research is for our clients only. Other than disclosures relating to Goldman Sachs, this research is based on current public information that we consider reliable, but we do not represent it is accurate or complete, and it should not be relied on as such. We seek to update our research as appropriate, but various regulations may prevent us from doing so. Other than certain industry reports published on a periodic basis, the large majority of reports are published at irregular intervals as appropriate in the analyst's judgment. Goldman Sachs conducts a global full-service, integrated investment banking, investment management, and brokerage business. We have investment banking and other business relationships with a substantial percentage of the companies covered by our Global Investment Research Division. Goldman, Sachs & Co., the United States broker dealer, is a member of SIPC (http://www.sipc.org). Our salespeople, traders, and other professionals may provide oral or written market commentary or trading strategies to our clients and our proprietary trading desks that reflect opinions that are contrary to the opinions expressed in this research. Our asset management area, our proprietary trading desks and investing businesses may make investment decisions that are inconsistent with the recommendations or views expressed in this research. The analysts named in this report may have from time to time discussed with our clients, including Goldman Sachs salespersons and traders, or may discuss in this report, trading strategies that reference catalysts or events that may have a near-term impact on the market price of the equity securities discussed in this report, which impact may be directionally counter to the analyst's published price target expectations for such stocks. Any such trading strategies are distinct from and do not affect the analyst's fundamental equity rating for such stocks, which rating reflects a stock's return potential relative to its coverage group as described herein. We and our affiliates, officers, directors, and employees, excluding equity and credit analysts, will from time to time have long or short positions in, act as principal in, and buy or sell, the securities or derivatives, if any, referred to in this research. This research is not an offer to sell or the solicitation of an offer to buy any security in any jurisdiction where such an offer or solicitation would be illegal. It does not constitute a personal recommendation or take into account the particular investment objectives, financial situations, or needs of individual clients. Clients should consider whether any advice or recommendation in this research is suitable for their particular circumstances and, if appropriate, seek professional advice, including tax advice. The price and value of investments referred to in this research and the income from them may fluctuate. Past performance is not a guide to future performance, future returns are not guaranteed, and a loss of original capital may occur. Fluctuations in exchange rates could have adverse effects on the value or price of, or income derived from, certain investments. Certain transactions, including those involving futures, options, and other derivatives, give rise to substantial risk and are not suitable for all investors. Investors should review current options disclosure documents which are available from Goldman Sachs sales representatives or at http://www.theocc.com/about/publications/character-risks.jsp. Transaction costs may be significant in option strategies calling for multiple purchase and sales of options such as spreads. Supporting documentation will be supplied upon request. All research reports are disseminated and available to all clients simultaneously through electronic publication to our internal client websites. Not all research content is redistributed to our clients or available to third-party aggregators, nor is Goldman Sachs responsible for the redistribution of our research by third party aggregators. For research or data available on a particular security, please contact your sales representative or go to http://360.gs.com. Disclosure information is also available at http://www.gs.com/research/hedge.html or from Research Compliance, 200 West Street, New York, NY 10282. © 2014 Goldman Sachs. No part of this material may be (i) copied, photocopied or duplicated in any form by any means or (ii) redistributed without the prior written consent of The Goldman Sachs Group, Inc. Goldman Sachs Global Investment Research 4

